This product shows a graphical representation of the Arctic Oscillation (AO) and the North Atlantic Oscillation (NAO) teleconnections relevant to European weather pattern. The forecasts from ECMWF, GFS and CFS (ensemble/operational) models are shown, as well as historic data back up to 1 year.
The MetDesk NAO index is an eastern North Atlantic based version of the NAO. The index is calculated using meridional differences in 500mb geopotential height at a range of latitudes in this region. The resulting anomalies from the climatological mean difference are then found and a non-linear regression is applied to convert to an index, comparable in scale and magnitude to other NAO indices. Being eastern North Atlantic based, the MetDesk index is particularly useful for European traders, compared to other versions where the European signal can be masked by the synoptic pattern in the western Atlantic.
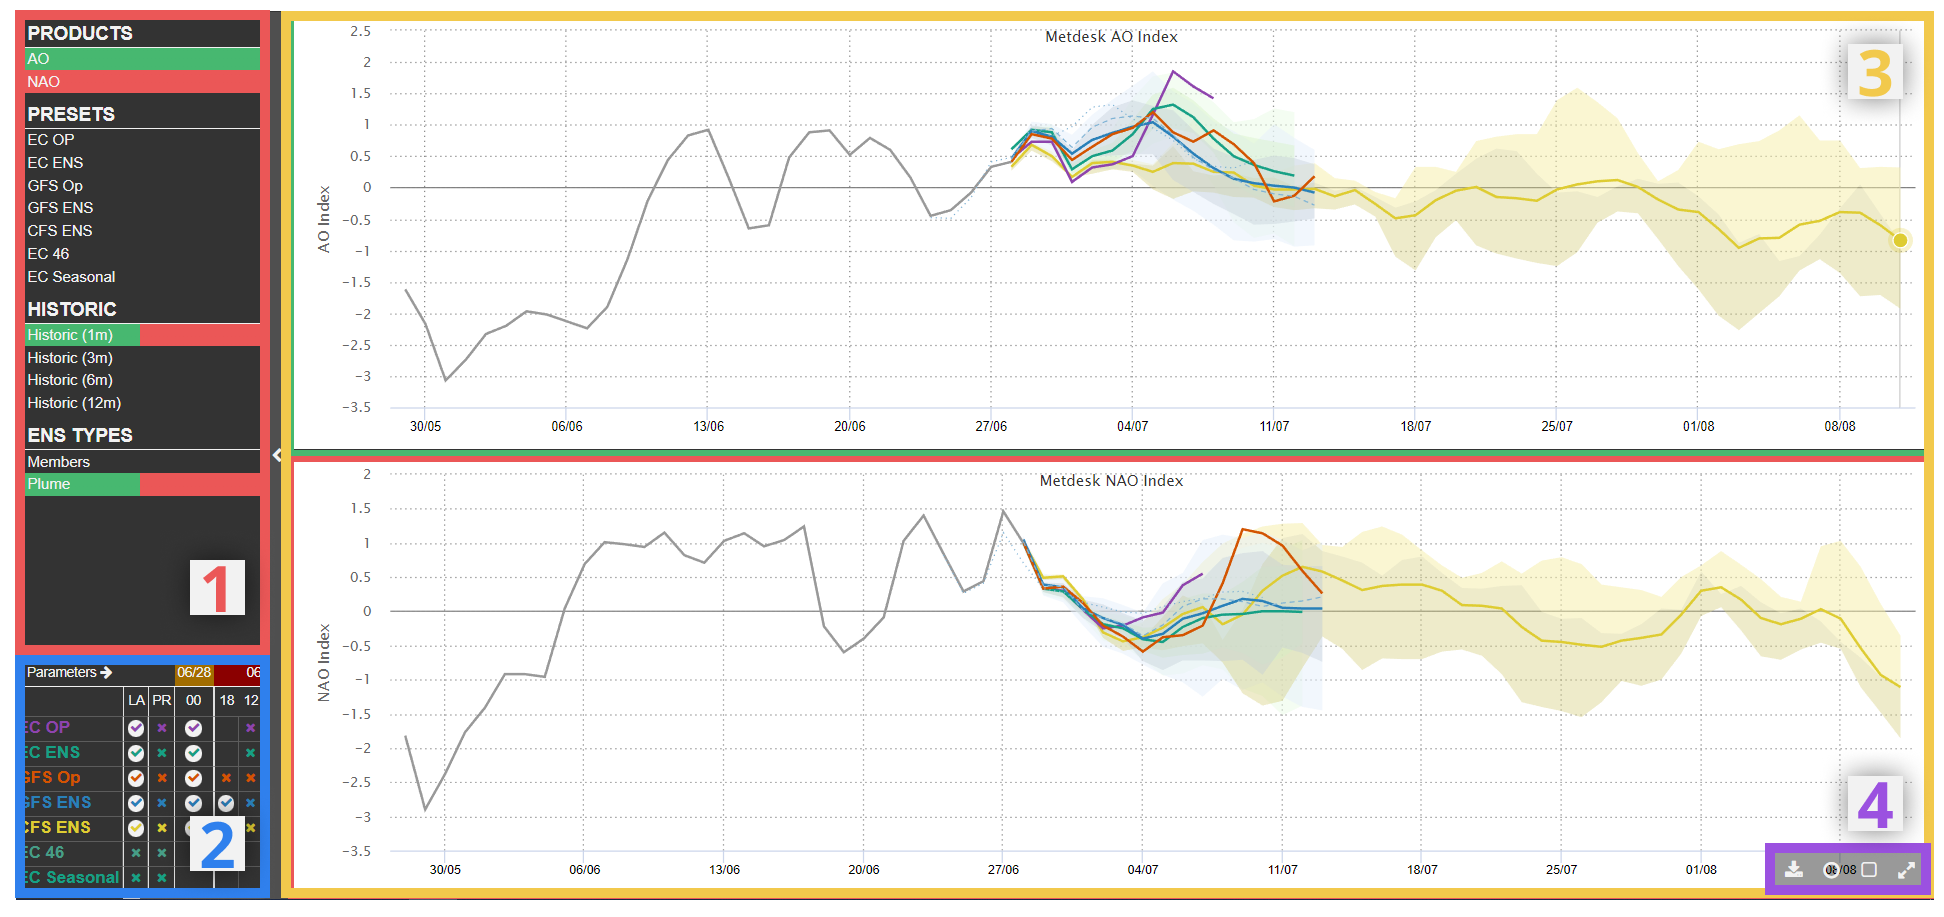
¶ 1) Options Panel
Here the user can select various options:
- Model presets (i.e. selecting on/off the data from the most recent two runs of a given model)
- Toggle between showing ensemble members individually or as a plume
- Historic observations can be toggled on/off both graphs using the panel on the left hand side.
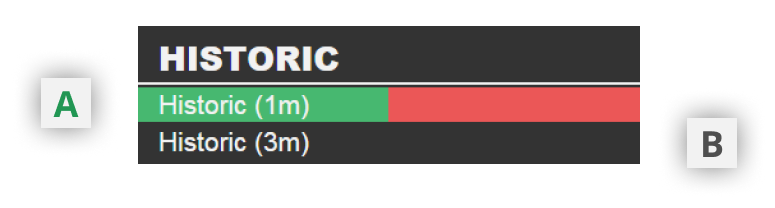
A. Selected on both AO/NAO graphs
B. Unselelected on both graphs
¶ 2) Matrix
This compact matrix enables quick toggling on/off of model runs
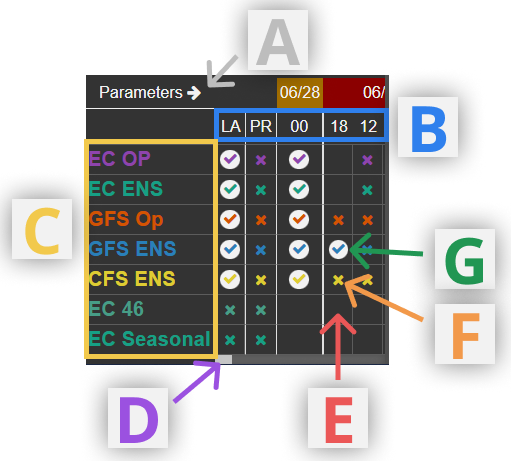
A. Expand matrix to include model runs back to 7 days
B. List of available model runs
Some models are not available at each time given. "LA" selects the latest available run for a given model. "PR" selects the model run before the latest available for a given model. Selecting "LA", "PR", or any of the available model run times will display all available data for that time.
C. List of available models
Selecting a model here will display the most recent two model runs
D. Scroll back to older model runs
E. Example of model run unavailable
F. Example of unselelected but available model run
G. Example of selected model run
¶ 3) Charts
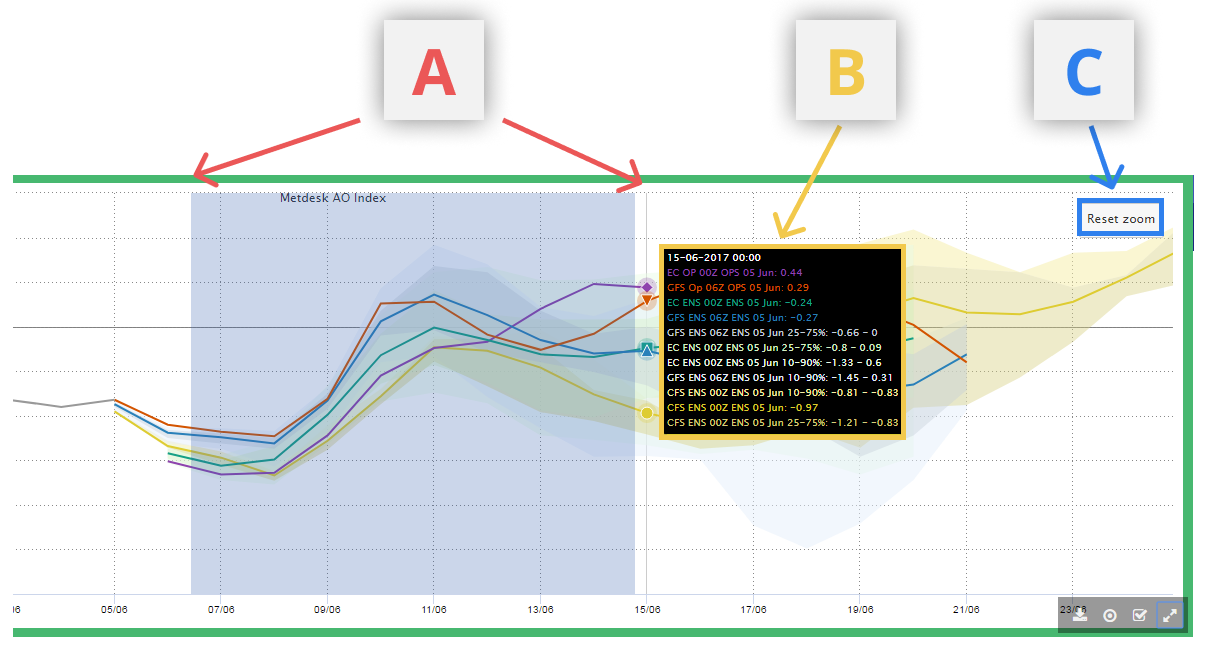
A. Zoom in
To restrict the temporal boundaries of the graph, click at the position of the start date/time and drag towards the desired end date/time.
B. Tooltips
When hovering over the graphs, gives numerical values for selected model runs at the date/time the mouse is positioned at.
C. Reset Zoom
¶ 4) Toolbar
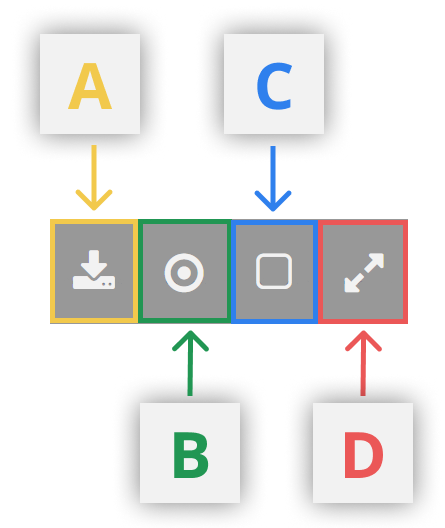
A. Download Data
Download the raw data from the charts in csv format
B. Toggle tooltips on/off
C. Select/Unselect to make changes to just one graph
This can also be done by clicking anywhere on the graph area
D. Full screen