These graphs show the bias for some of the models used within the Country Weighted Graphs (CWGs) product. Biases from observed values are shown for each model, each of the elements, and for any (or a combination of) the countries. The (Root Mean Square Error) RMSE is also available for plotting. The user can determine the range of time over which the bias/RMSE is calculated.
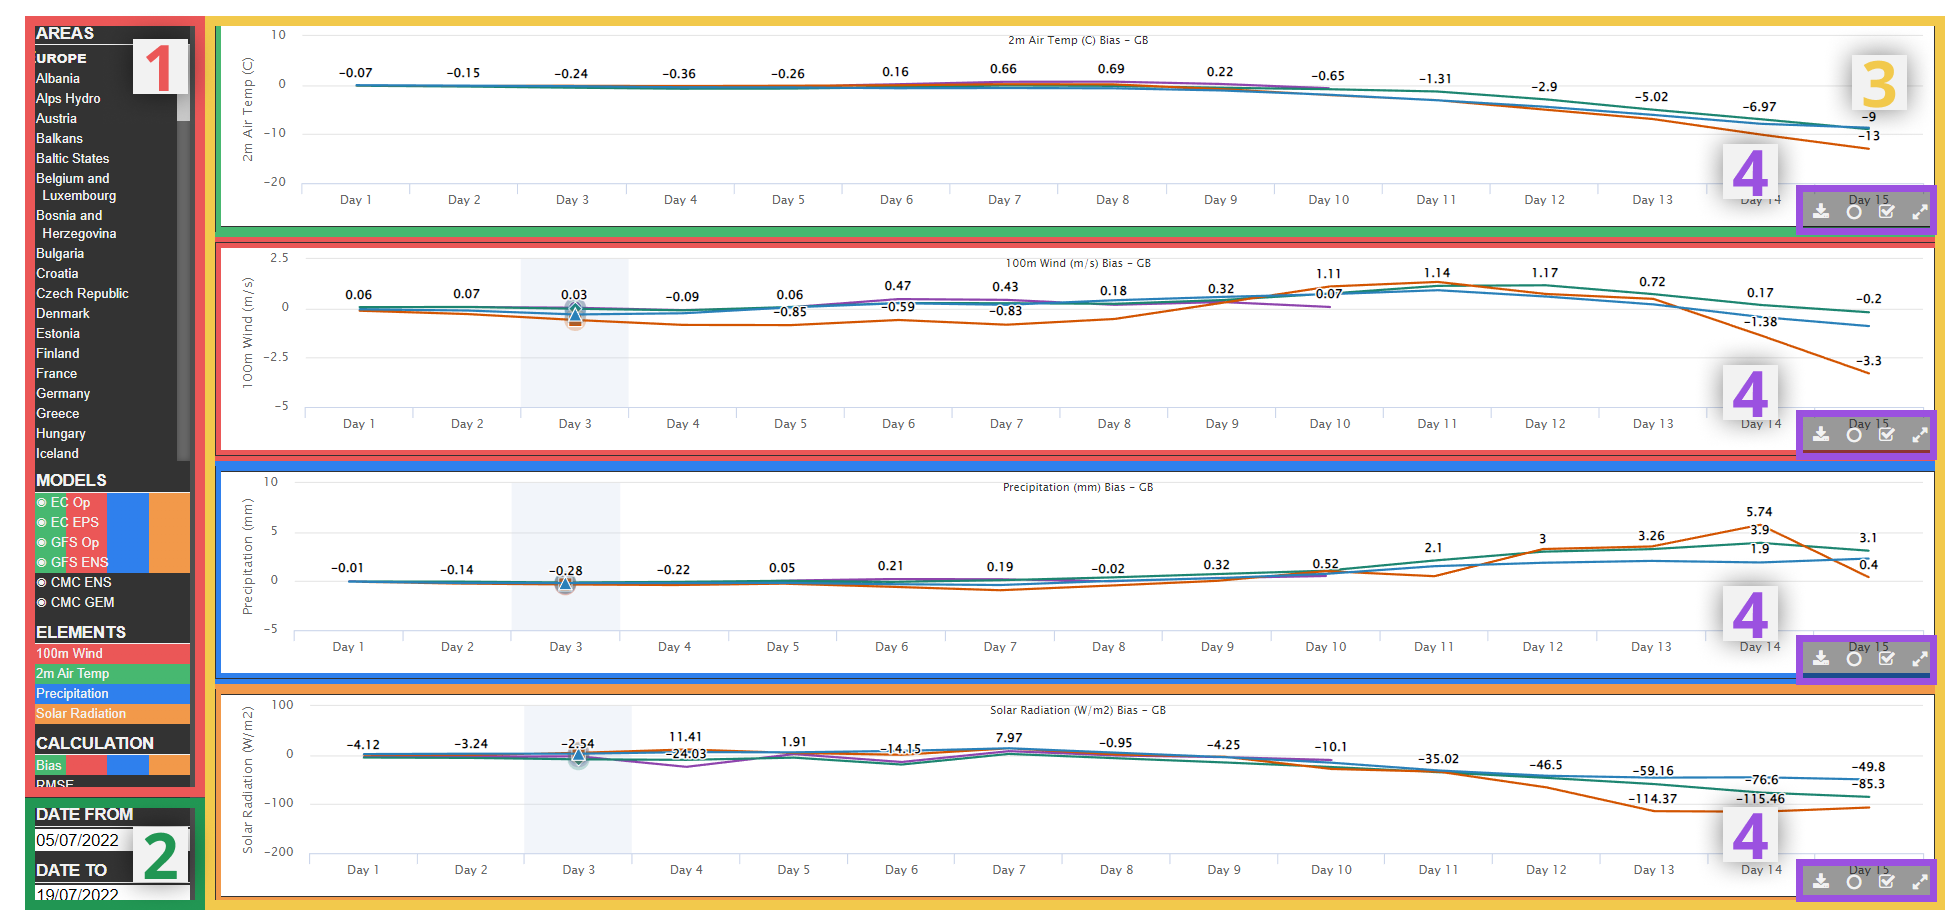
¶ 1) Panel
The panel area allows the user to select the content for the graphs. As default, changes made in the panel will alter all four of the graphs shown on the page, but changes to individual graphs can be made by first selecting the desired graph(s). This can be done by using the relevant button in the toolbar (see section 4). Each of the graphs are colour coded, so it is easy to see which settings are selected for each graph in the panel.
The available settings to be changed in the panel are as follows:
- Areas - Select country or region for bias/RMSE calculation.
Note multiple countries can be selected for a graph, giving an aggregated calculation. Select a country/region to add to the aggregation and select again to remove.
- Elements - Toggle between 100m wind speed, 2m temperature, solar radiation and precipitation.
- Calculation - Toggle between bias and RMSE calculations

A. Option selected by graph 1 (green, top of the page)
B. Option selected by graphs 2-4
C. Option unselected by available
¶ 2) Date selector
The user has full control on the period over which the biases/RMSE are calculated.
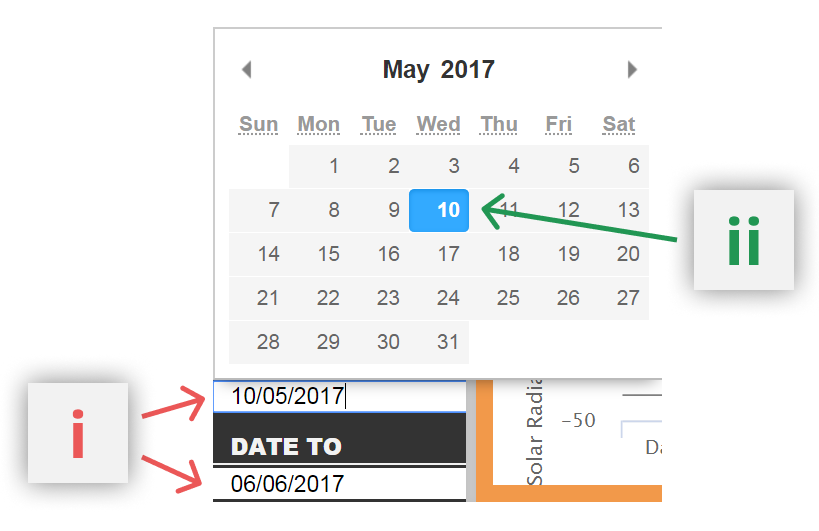
i. Select the start or end date category
ii. Select the exact date for start/end of calculation
¶ 3) Graph
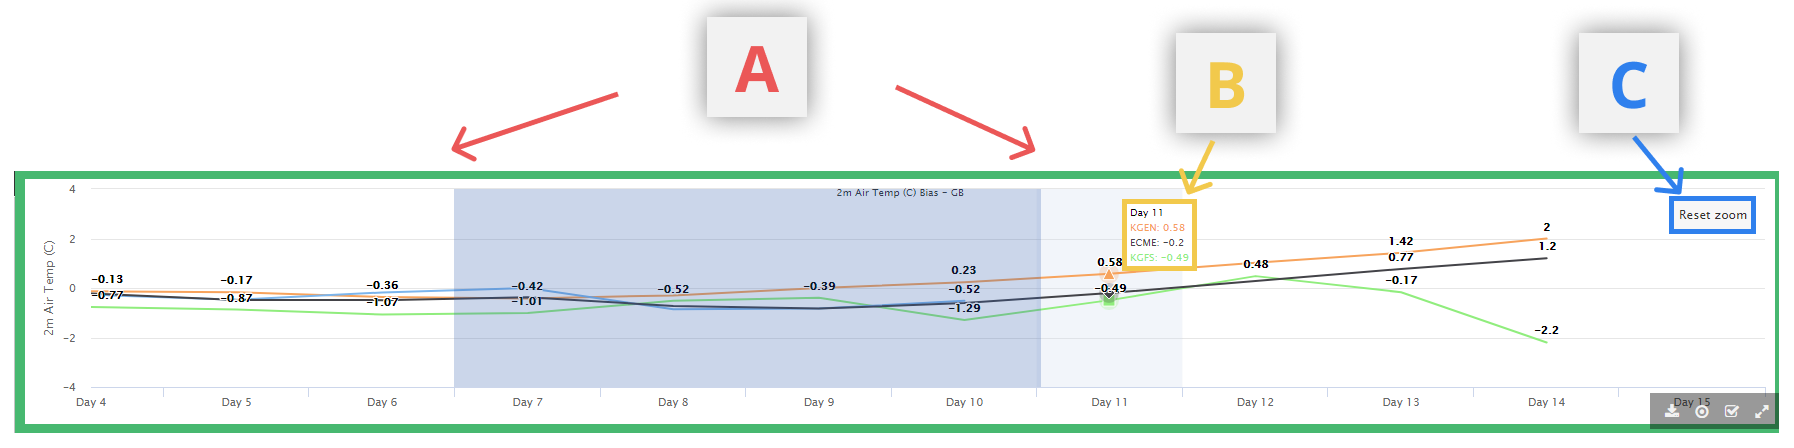
A. Zoom in
To restrict the temporal boundaries of the graph, click at the position of the start date/time and drag towards the desired end date/time.
B. Tooltips
When hovering over the graphs, gives numerical values for selected model runs at the date/time the mouse is positioned at.
C. Reset Zoom
¶ 4) Toolbar
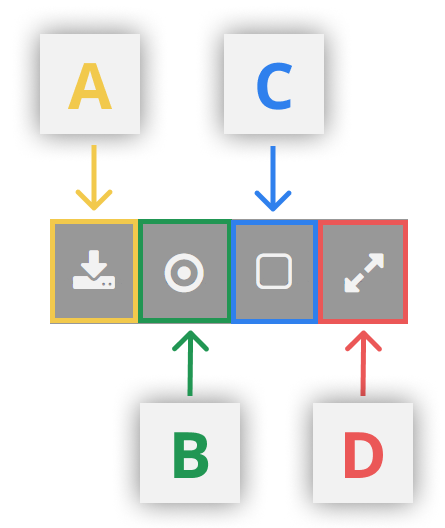
A. Download Data
Download the raw data from the charts in csv format
B. Toggle tooltips on/off
C. Select/Unselect to make changes to just one graph
This can also be done by clicking anywhere on the graph area
D. Full screen