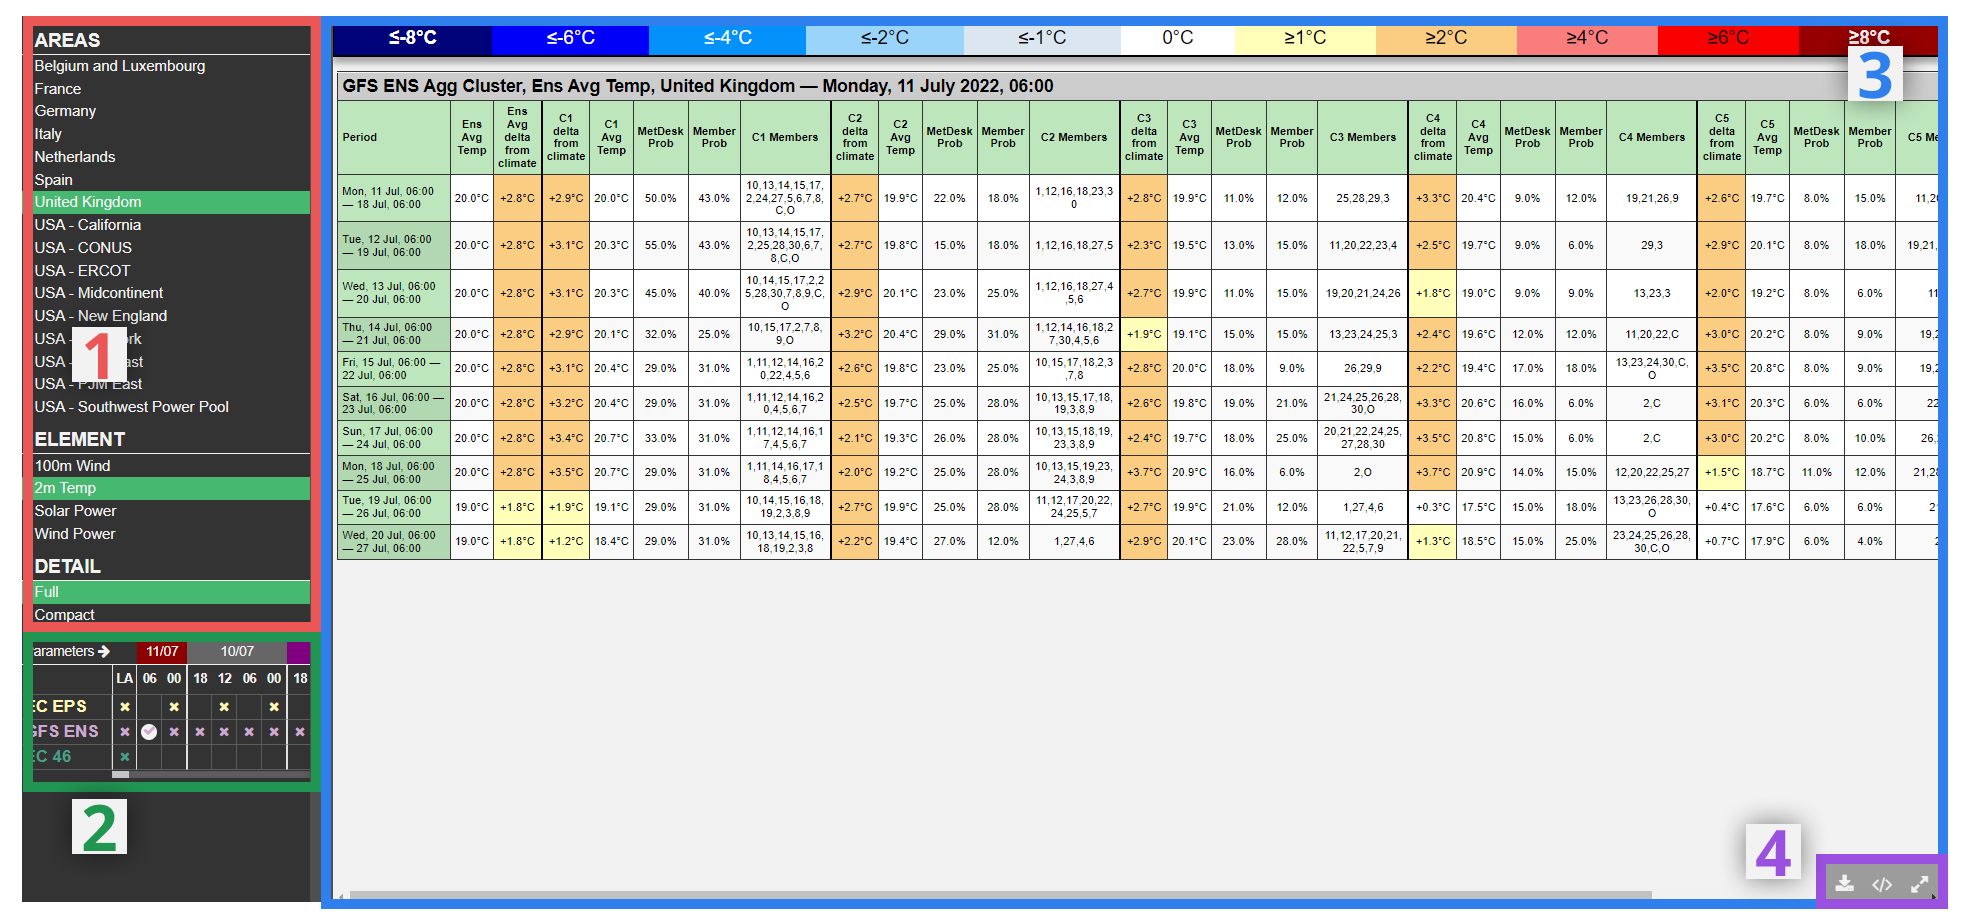
The cluster tables show in tabular form the possible forecast scenarios within an ensemble model run. For each week-long period in the model run, up to six clusters are identified but MetDesk's intelligent algorithms. Each cluster is assigned a probably based on the number of ensemble members and how closely they resemble each other. For each of the clusters, the temperature anomalies for the chosen country is displayed for either temperature or wind.
¶ 1) Table Selection
Here users can select the area and element for the cluster table as well as switching between the 'Full' and 'Compact' modes. The 'Full' model lists all members in each cluster.
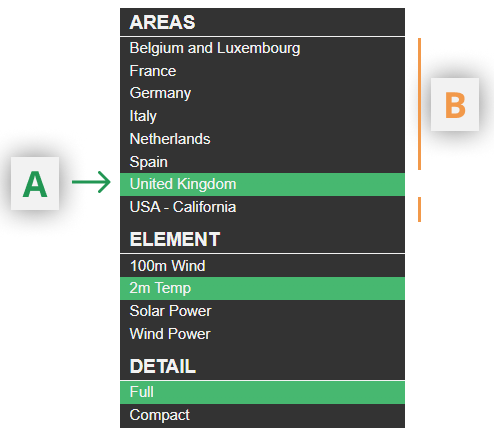
A. Selected
B. Available but Unselected
¶ 2) Model Matrix
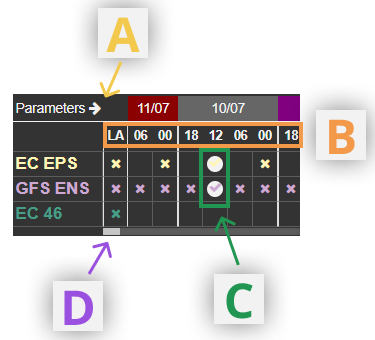
A. Expand matrix to include model runs back to 7 days
B. List of available model runs
Some models are not available at each time given. "LA" selects the latest available run for a given model. Selecting "LA" or any of the available model run times will display all available data for that time.
C. Example of model run selected
D. Scroll back to older model runs
¶ 3) Cluster Table
¶ 4) Toolbar
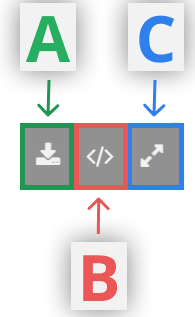
A. Download data (raw csv)
B. Download data (xml)
Unlike option A, this format is more easily viewed with styling in spreadsheets
C. Full Screen
Select to view the cluster table in full screen. Once in full screen, this same button will then become the option to return to the default view.