Country Weighted Graphs (CWGs) are designed to assist traders and meteorologists quickly understand the national or regional implications of the latest model run temperatures, precipitation, 100m wind and solar radiation data, comparing various models and runs. MetDesk uses appropriate population weightings, weighted locations of power generating assets, as well as model bias corrections as appropriate to graph the data for a variety of countries/areas for a large range of global models, with the ability to compare run data with recent model runs. Parameters are also compared against the climate average and observations.
As a new model run is being released, the country weighted graphs are rendered as each new time step is released by the model provider.
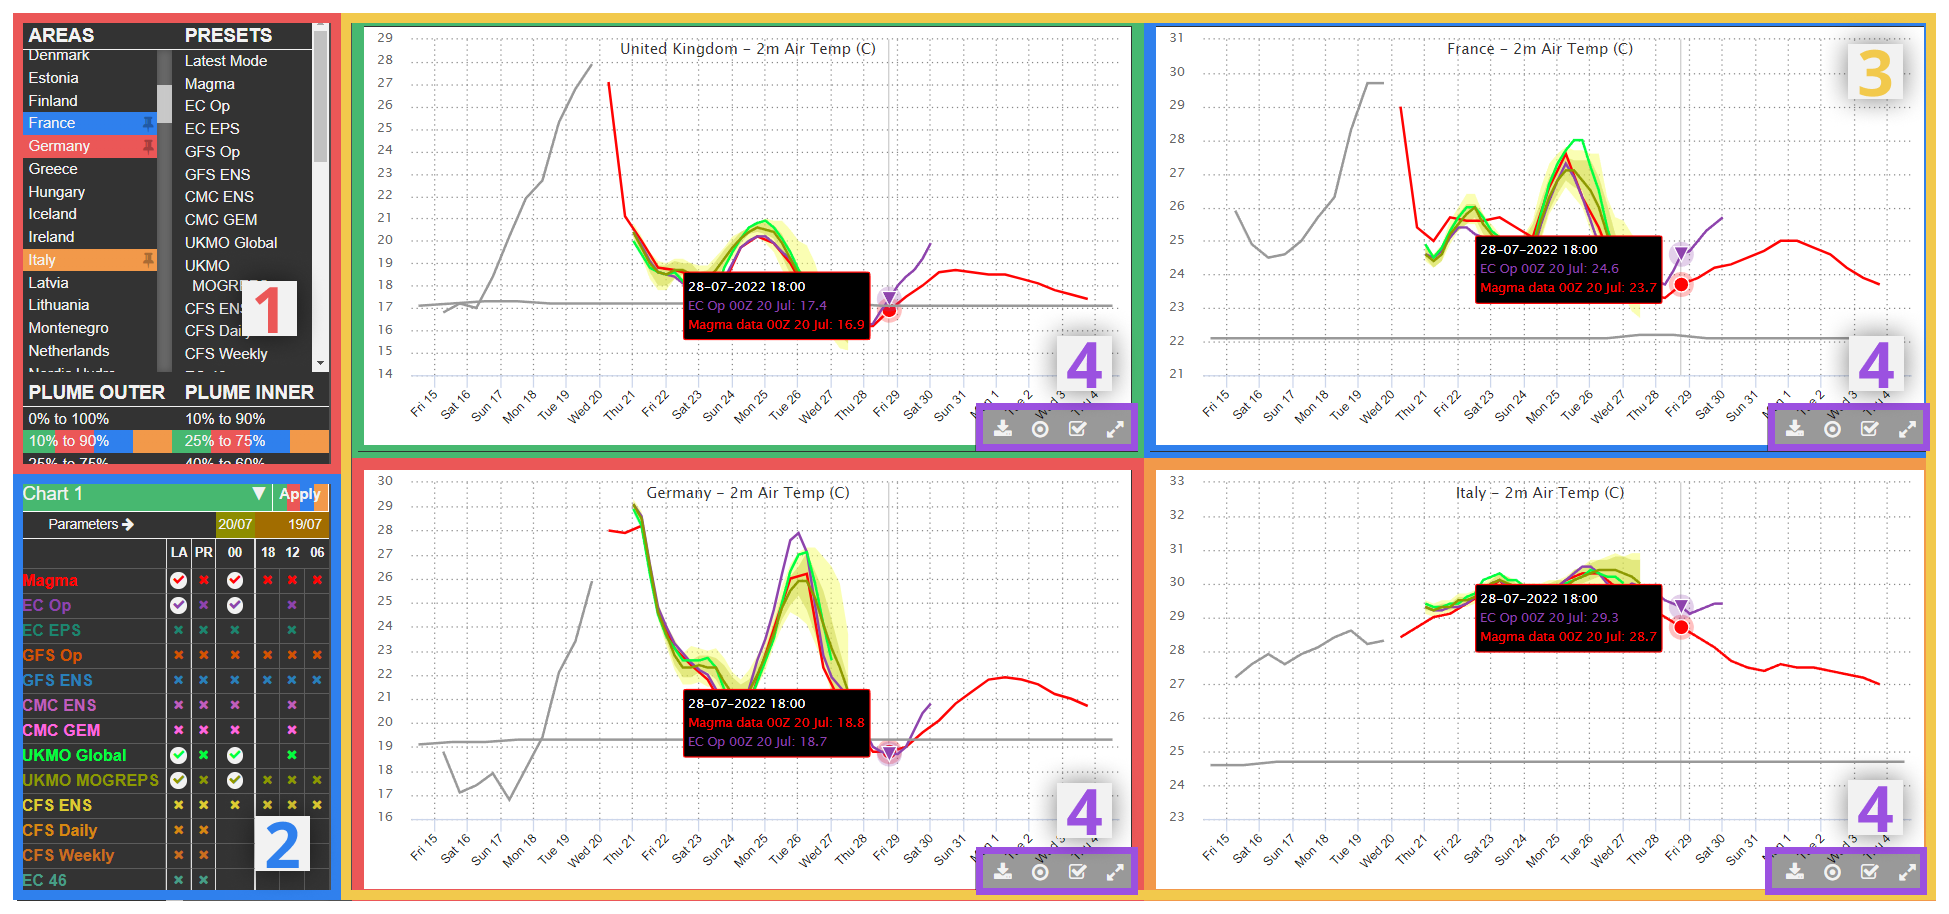
¶ 1) Panel
The panel to the top-left of the screen allows the user to make adjustments to the content on the graphs (except the choice of model, which is in section 2). As default, changes made in the panel will alter all four of the graphs shown on the page, but changes to individual graphs can be made by first selecting the desired graph(s). This can be done by using the relevant button in the toolbar (see section 4). Each of the graphs are colour coded, so it is easy to see which settings are selected for each graph in the panel.
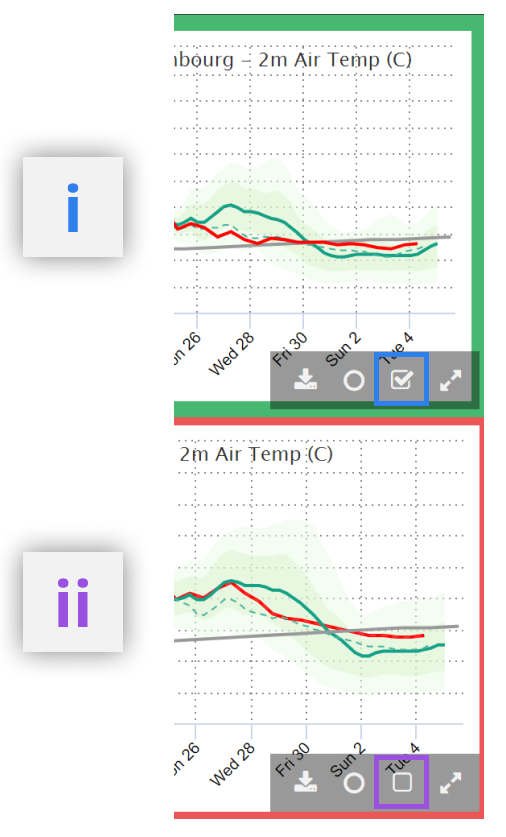
i. Selected graph
Note ticked box in toolbar and thicker coloured outline to the graph
ii. Unselected graph
Note unticked box in toolbar and default thickness of coloured outline
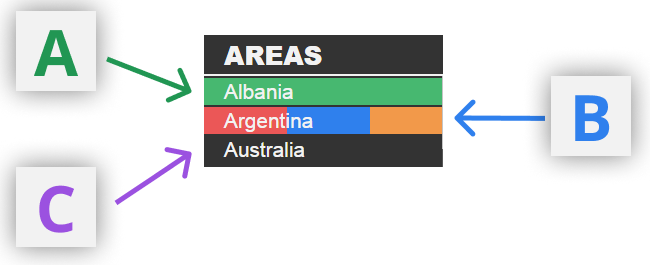
A. Option selected by graph 1 (top-left, green outline) only
B. Option selected by graphs 2,3,4 (blue,red,orange)
C. Option available but not selected on any graphs
The available settings to be changed in the panel are as follows:
- Areas - Select country/region to be displayed on the graph
- Presets - Select/deselect each of the available models, include MAGMA. The latest and previous runs of the selected model will be displayed. Here the user will also find "latest mode" which is a preset that automatically switches to the most recent model run.
- Elements - Toggle between 100m wind, 2m air temperature, precipitation, and solar radiation
- Obs Types - Toggle on/off climatology and add observations back 5, 15, 30 or 60 days
- Ens Types - Select/deselect different ways to display ensemble model output, including the option to show all members or just the mean, medium or mode.
- Plume Outer - Change the width of the outer plume when selected for display on the graph. Choose between three set options.
- Plume Inner - Change the width of the inner plume when selected for display on the graph. Choose between three set options.
¶ 2) Model Matrix
This compact matrix enables quick toggling on/off of model runs. As default, making changes in the matrix will affect all graphs, but selecting one or more graphs will enable the changes to be made to specific graphs only.
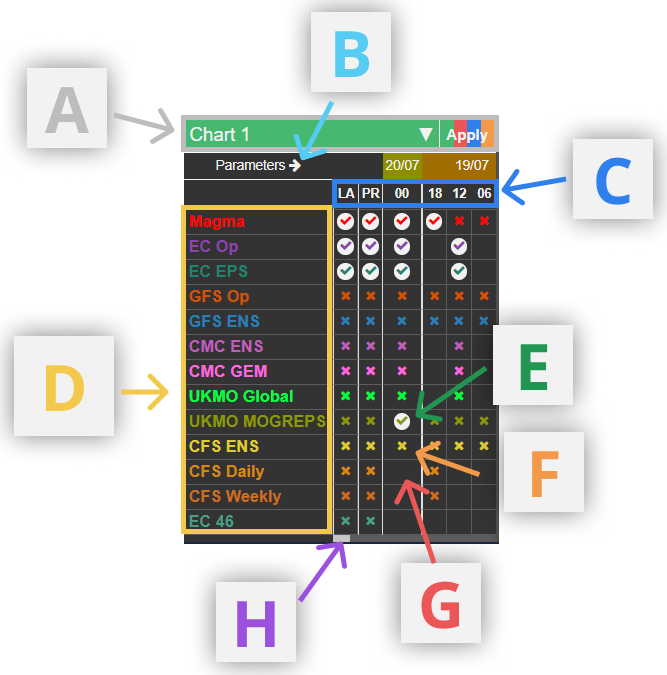
A. Select Chart (from top-left to bottom-right) from dropdown menu
Choices made in the rest of the matrix will as default only affect the chosen chart. To apply the changes (in terms of model runs only) to the rest of the matrices, select "Apply" to the right of the drop-down.
B. Expand matrix to include model runs back 1 month
C. List of available model runs
Some models are not available at each time given. "LA" selects the latest available run for a given model. "PR" selects the model run before the latest available for a given model. Selecting "LA", "PR", or any of the available model run times will display all available data for that time.
D. List of available models
Includes our in-house MAGMA model, providing the best combination of other model data
MAGMA updates as new model data comes in. The most recent data is available using "LA" or the most recent hour in the matrix. Without changing the selection here, the MAGMA data will adjust to new incoming data. Every 6 hours, the data from MAGMA runs are frozen and kept in the matrix.
When a new 6-hourly MAGMA run arrives in the matrix (e.g. "06"), then the data behind the previous MAGMA step displayed (i.e. the "00" in this case) is then frozen with the current MAGMA data. This occurs once the first set of model starts to arrive from that new step's initialisation time. Hence, for the example of the "06" MAGMA, this starts to appear when the first 06z models start to arrive, which may be around 09:00-10:00GMT, and the rolling updates to the "00" MAGMA run will then stop. Thus, data arriving after 06:00GMT (including the ECMWF EPS 00z for example) will often still be incorporated into the "00" MAGMA run stored in the matrix.
E. Example of selected model run
F. Example of unselelected but available model run
G. Example of model run unavailable
H. Scroll back to older model runs
¶ 3) Graph Areas
There are two different CWG products available on Trading Weather: one with a single graph and one with four graphs. The user can also create a dashboard with any number of graphs.
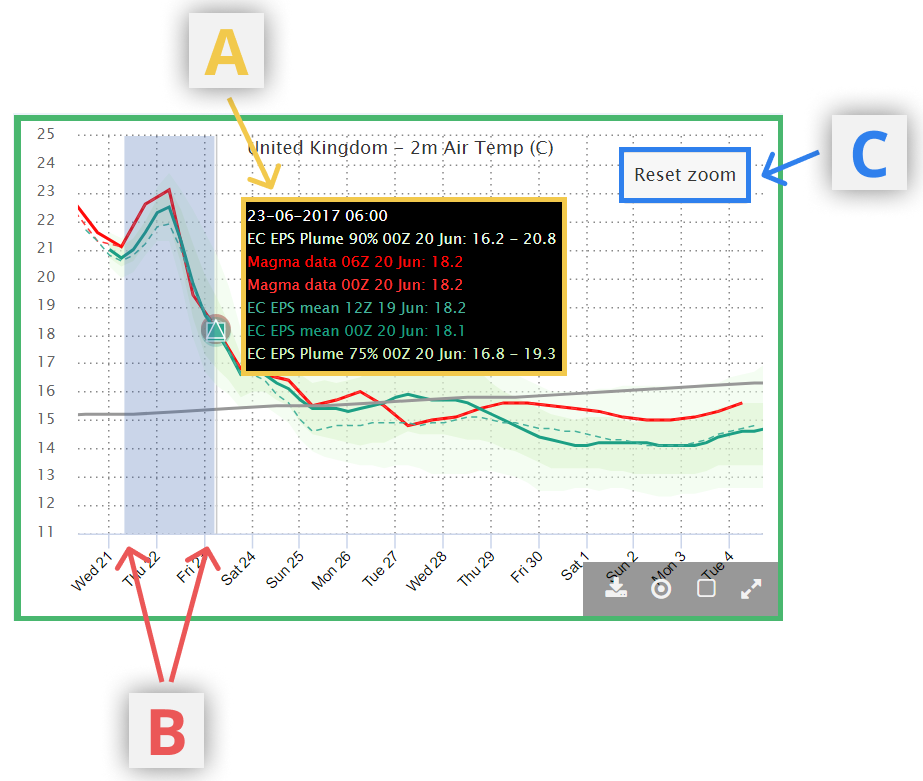
A. Tooltips
When hovering over the graphs, these give numerical values for selected model runs at the date/time the mouse is positioned at.
B. Zoom in
To restrict the temporal boundaries of the graph, click at the position of the start date/time and drag towards the desired end date/time.
C. Reset Zoom
Back to default view
Solid lines on the graphs represent the most recent run from a given model, whereas dotted/dashed lines are older runs.
Note that the data in the graphs has a temporal resolution of 6 hours and is a rolling 24-hour average, in order to smooth out diurnal variations in parameters such as precipitation and solar.
¶ 4) Toolbar
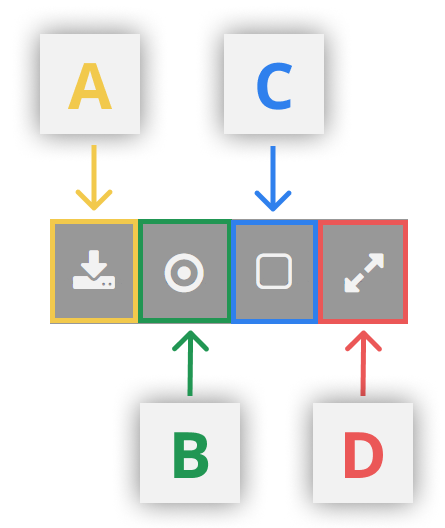
A. Download Data
Download the raw data from the graph in csv format
B. Toggle tooltips on/off
C. Select/Unselect to make changes to just one graph
This can also be done by clicking anywhere on the graph area
D. Full screen