Degree Days are measures of heating and cooling demand, essentially through a simplified representation of air temperature. A proxy for the amount of energy required to heat and cool infrastructure can be found taking the difference between an observed or forecast temperature and a base temperature. Below this base temperature, heating is required and above it some cooling is required. The base temperature for the United States is set at 18.3C. The larger the difference between vales of temperature and the base temperature, the greater the likely heating or cooling demand. Heating and cooling degree days can be combined (or added together) to produce a measure of demand across a wider area where there may be some heating and cooling required given temperature variation geographically. Degree days can also be accumulated over a period of days. Negative values of degree days are not possible.
Heating Degree Days = Actual/Forecast Temperature - Base Temperature (18.3C) >=0
Cooling Degree Days = Base Temperature (18.3C) - Actual/Forecast Temperature >=0Total Degree Days = Heating Degree Days + Cooling Degree Days
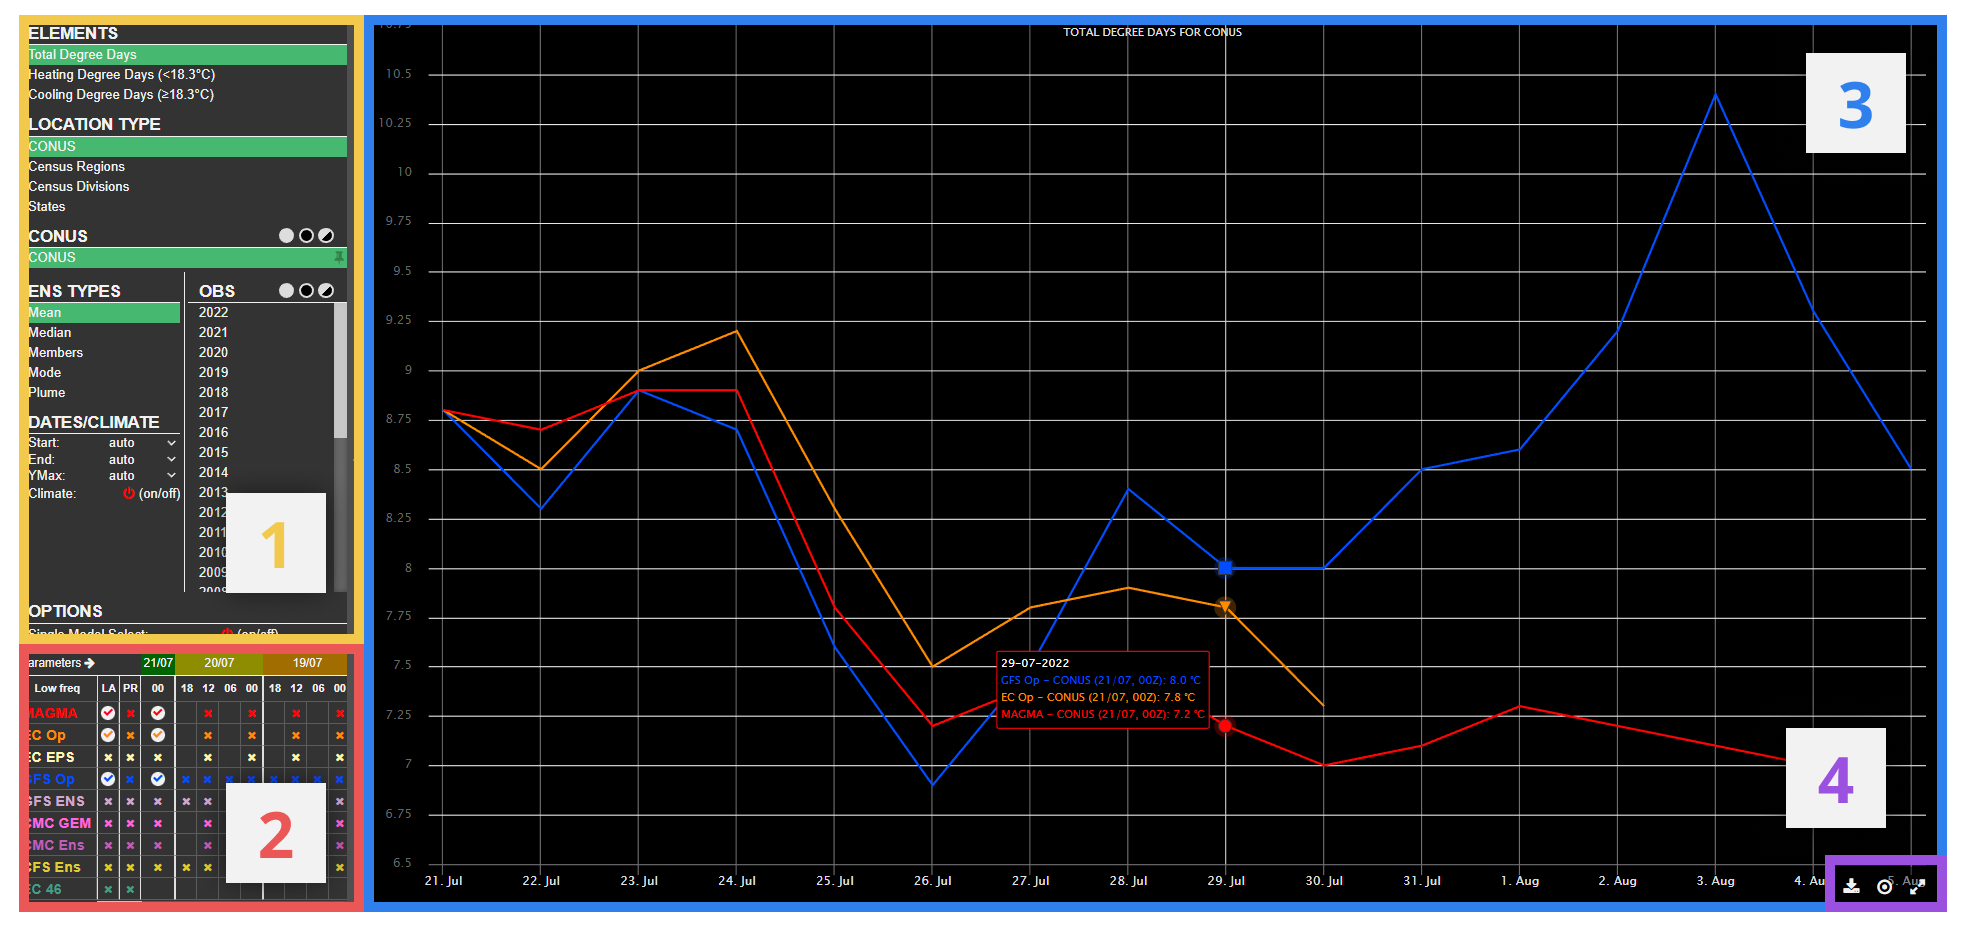
¶ 1) Panel
Here, the user can change the Degree Days data displayed in the chart. The following can be adjusted:
The following can be adjusted:
A. Elements
Choose from Total Degree Days, Heating Degree Days and Cooling Degree Days
B/C. Location Type
Choose the area over which the Degree Day calculations are displayed. Only those locations selected here will display any data on the chart. This ranges from one value for the whole contiguous United States (CONUS), to smaller sub-divisions of Census Regions, Divisions, and individual States. Selecting any of these options will bring up an additional menu below to choose specific locations within that category (e.g. between Northeast, Midwest, South and West for the Census Regions category).
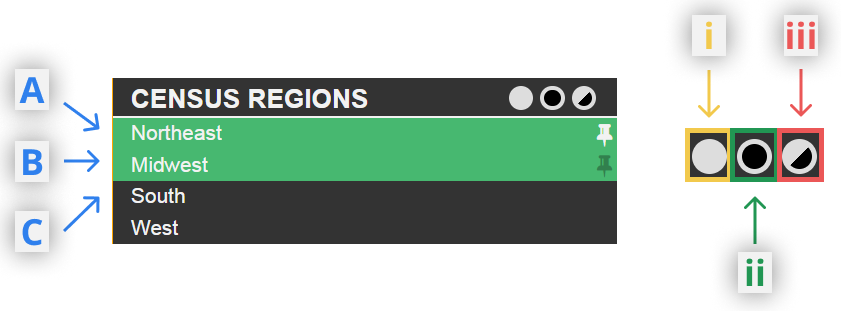
Location Selections:
A. Region selected and pinned to the top of menu
B. Region selected but not pinned
C. Region unselectedi. Select all regions
ii. Unselect all regions
iii. Invert the current selection of regions
D. ENS Type
When an ensemble forecast model is selected in the model matrix (see below), the form these data are displayed on the chart can be changed here. The mean is displayed as default, but other measures, including viewing all ensemble members can be selected.
E. Dates / Climate
Here, the user can determine the range of days available to be displayed on the chart. A value for climatology on each date selected can also be toggled on and off here.
F. Obs
Actual Degree Days data back to 1990 is available here to add to the chart. Multiple years can be displayed at once.
G. Options
One option here allows the user to toggle the 'Single Model Select' option on/off. When turned on, it is only possible to select one model or model run at a time in the model matrix (see below).
¶ 2) Model Matrix
The model matrix is where the user can determine which forecast model's data is displayed on the chart. Multiple model's data can be displayed at once. Simply tick a particular model run to display on the chart, and untick to remove.
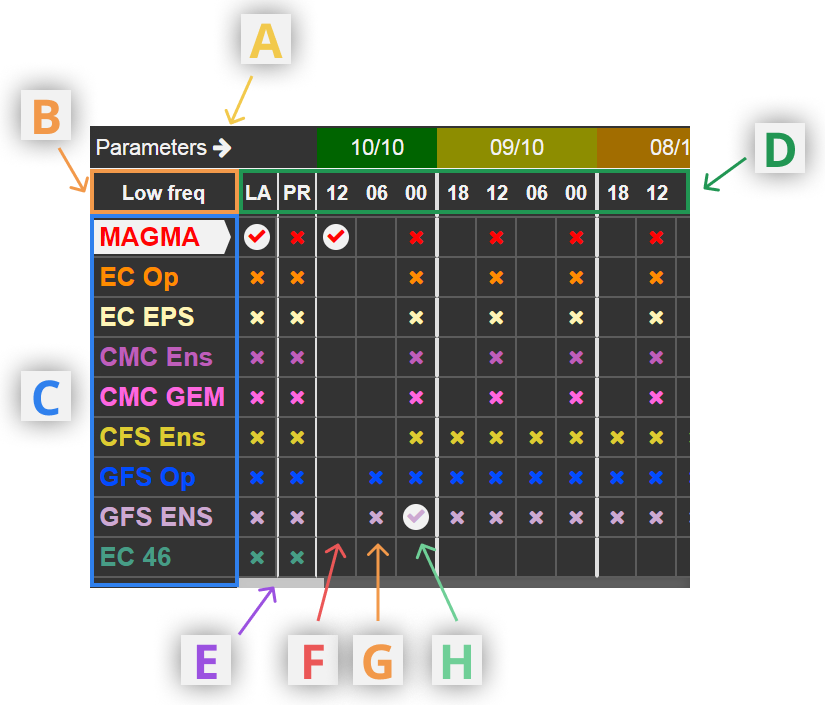
A. Expand matrix to include model runs back to 10 days
B. Toggle High/Low frequency
Click to switch between low frequency (multiples of 6 hours) or high frequency (greater resolution of model runs, down to hourly or 3-hourly model runs, including our MAGMA model.
C. List of available models
Selecting a model here will display the most recent two model runs
D. List of available model runs
Some models are not available at each time given. "LA" selects the latest available run for a given model. "PR" selects the model run before the latest available for a given model. Selecting "LA", "PR", or any of the available model run times will display all available data for that time.
For MAGMA, our in-house model, updates on a rolling basis as new model data comes in. The most recent data is available using "LA" or the most recent hour in the matrix. When a new hour arrives in the matrix (e.g. 06) then the data behind the previous step (i.e. 00) then is frozen with the current MAGMA data. Thus, the data included in a certain MAGMA snapshot does not necessarily include data from that hour's run of a certain model. For example, the "00" snapshot would not include the ECMWF EPS 00z data as that doesn't arrive until after 06:00GMT when the "00" snapshot is frozen. Instead, this data will be incorporated into the "06" MAGMA time slot.
E. Scroll back to older model runs
F. Example of model run unavailable
G. Example of unselelected but available model run
H. Example of selected model run
¶ 3) Chart
This product displays Degree Days in graphical form; both recent years' observations and forecast model output. The content of the chart is determined by options in the panel and model matrix, located to the left of the screen, and described above in sections 1 and 2.
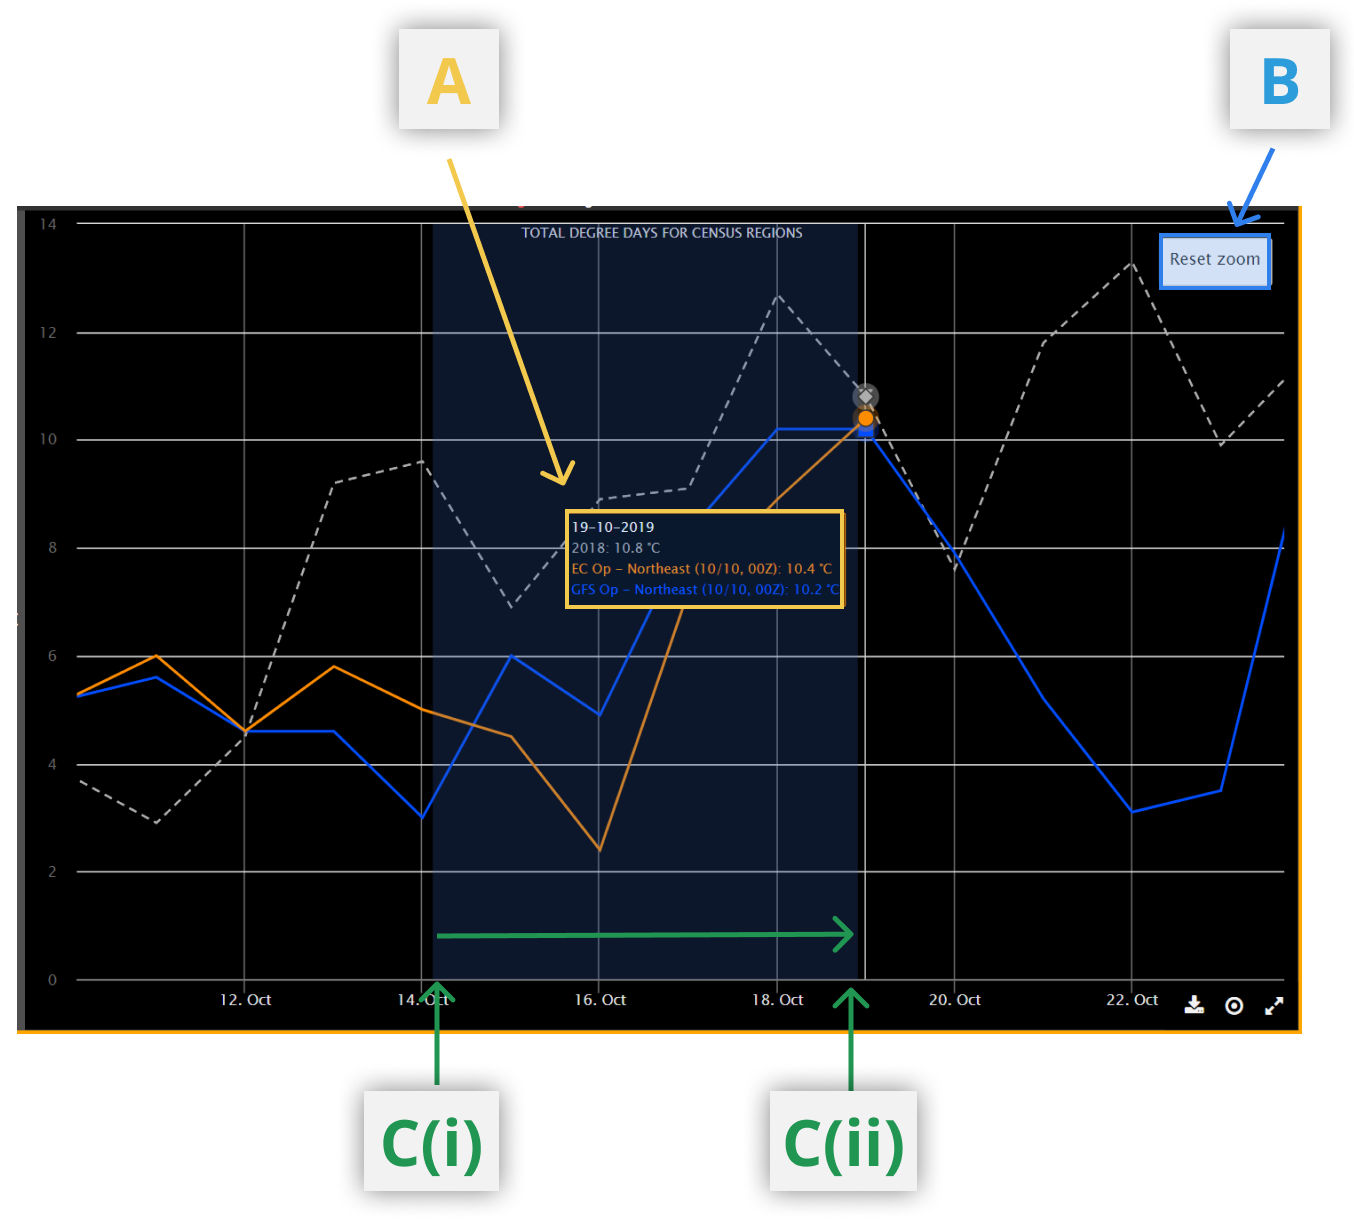
A. Tooltips
When hovering over the graphs, these give numerical values for selected model runs. Simply hover over the desired time to see the numerical data.
B. Reset Zoom
C. Zoom
Draging C(i) to C(ii) to zoom in to the chart
¶ 4) Toolbar
To the bottom right of the screen, a small toolbar gives the user three options:
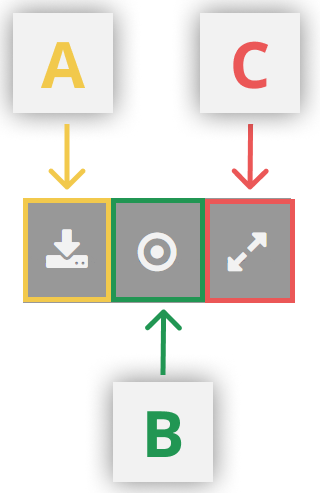
A. Download Data
Download the raw data from the graph in csv format, as determined by selections in the matrix and panel)
B. Toggle tooltips on/off
C. Full screen