Ensemble Charts (or EPS) is a product for graphically viewing site specific forecasts for a number of locations across the globe. A range of operational and ensemble models are available with a large archive of previous model runs. The ensembles can be viewed in a number of ways, including via plumes and plotting all ensemble members. Users can create their own custom areas to be plotted, using a combination of different locations, and with adjustable weightings in each to suit requirements. Parameters can be viewed against climatology and in addition to observations.
¶ 1) Panel
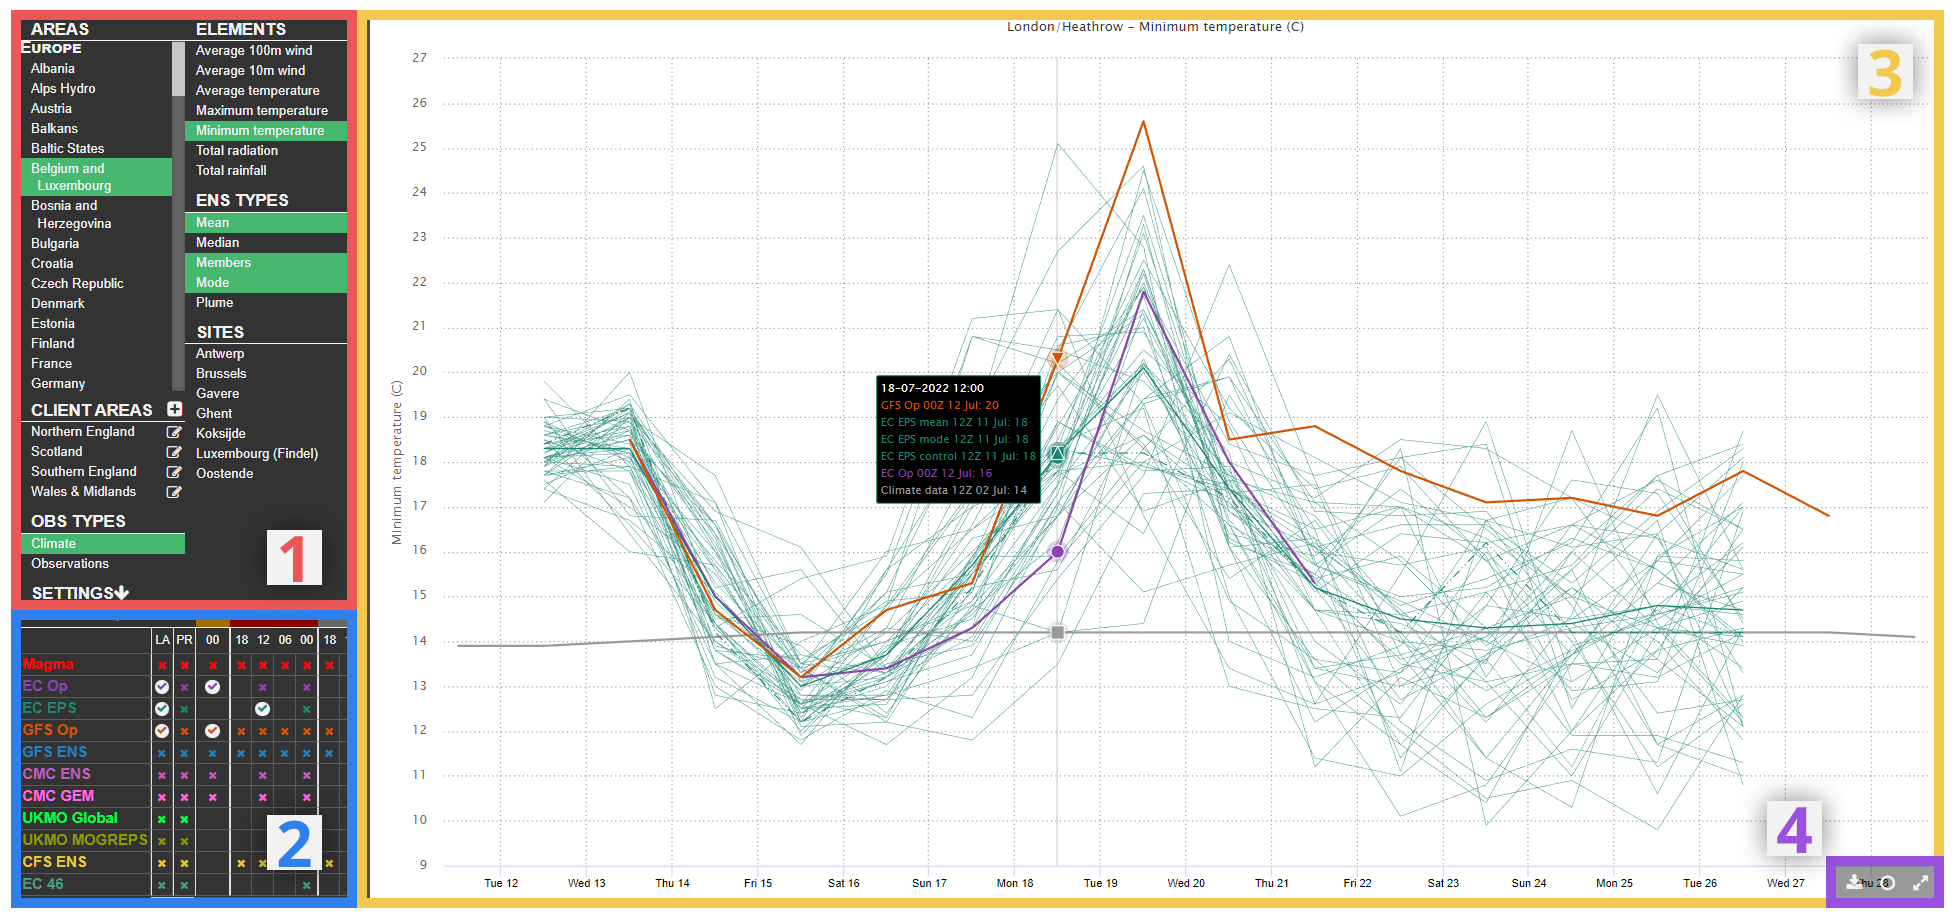
The panel to the top-left of the screen is where users alter what is displayed on the graph, apart from the choice of model data (see model matrix below).

A. Selected option
B. Available but unselected option
The available settings to be changed in the panel are as follows:
- Areas - Select country to be displayed on the graph (also custom areas, see section below)
- Sites - Select individual site/location in a given country
- Elements - Toggle between 10m/100m wind, 2m air temperature (Avg, Max, Min), precipitation, and solar radiation
- Obs Types - Toggle on/off climatology and add observations
- Ens Types - Select/deselect different ways to display ensemble model output, including the option to show all members or just the mean, medium or mode.
¶ Settings
Hover over the "Settings" heading towards the bottom of the panel to reveal the following further settings:
- Xaxis Min - Change the starting time on the x-axis (either automatic or in terms of days)
- Xaxis Max - Change the ending time on the x-axis (either automatic or in terms of days)
- Plume Outer - Change the width of the outer plume when selected for display on the graph. Choose between three set options.
- Plume Inner - Change the width of the inner plume when selected for display on the graph. Choose between three set options.
¶ Custom Areas
Here, a user can create a graph with combines data from multiple sites and weights them according to user-defined levels.
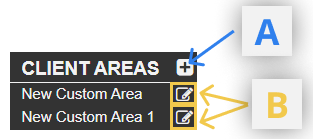
A. Create a new custom area
B. Edit a previously made custom area
When a new custom area is created, a new display appears in the panel allowing the user to select locations for the area and give each of them a weighting.
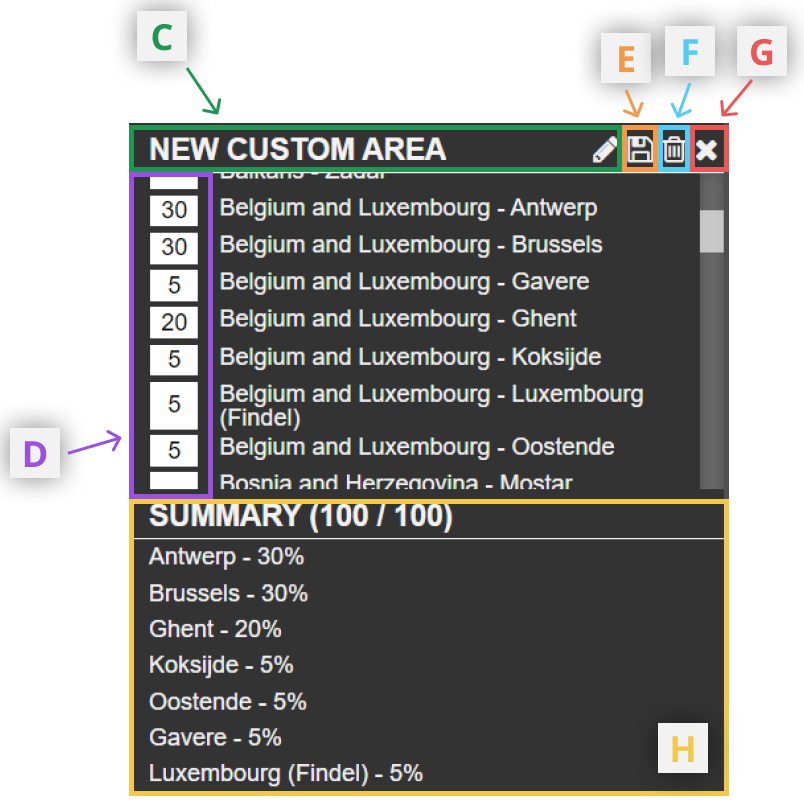
C. Rename the custom area
D. Add/change weightings to each site
Scroll up/down to access all available sites
Type in a weighting into each site required. The sum of all values in this column must add up to 100 e.g. for two equally weighted sites add "50" to both boxes.
Those boxes left blank will not be includes in the graph
E. Save the custom area or the changes made to it
F. Delete the custom area
This option is only available once a custom area has been saved. To discard a new custom area, use option 7 (below).
G. Discard a new custom area or cancel changes made to a previously saved custom area.
H. Summary
A summary of the weightings currently included in the custom area. To operate correctly, the summary must show (100 / 100).
¶ 2) Model Matrix
Whilst all other options are selected through the panel, the toggling on/off of model runs is done through the matrix.
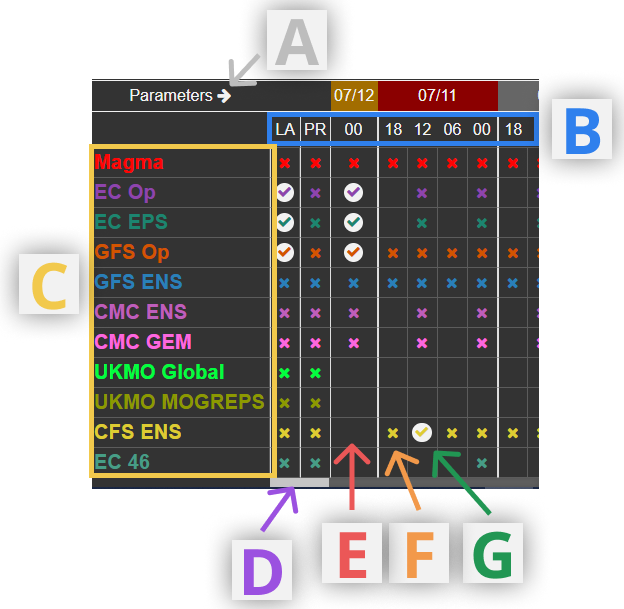
A. Expand matrix to include model runs back to 7 days
B. List of available model runs
Some models are not available at each time given. "LA" selects the latest available run for a given model. "PR" selects the model run before the latest available for a given model. Selecting "LA", "PR", or any of the available model run times will display all available data for that time.
C. List of available models
Selecting a model here will display the most recent two model runs
D. Scroll back to older model runs
E. Example of model run unavailable
F. Example of unselelected but available model run
G. Example of selected model run
¶ 3) Graph Area
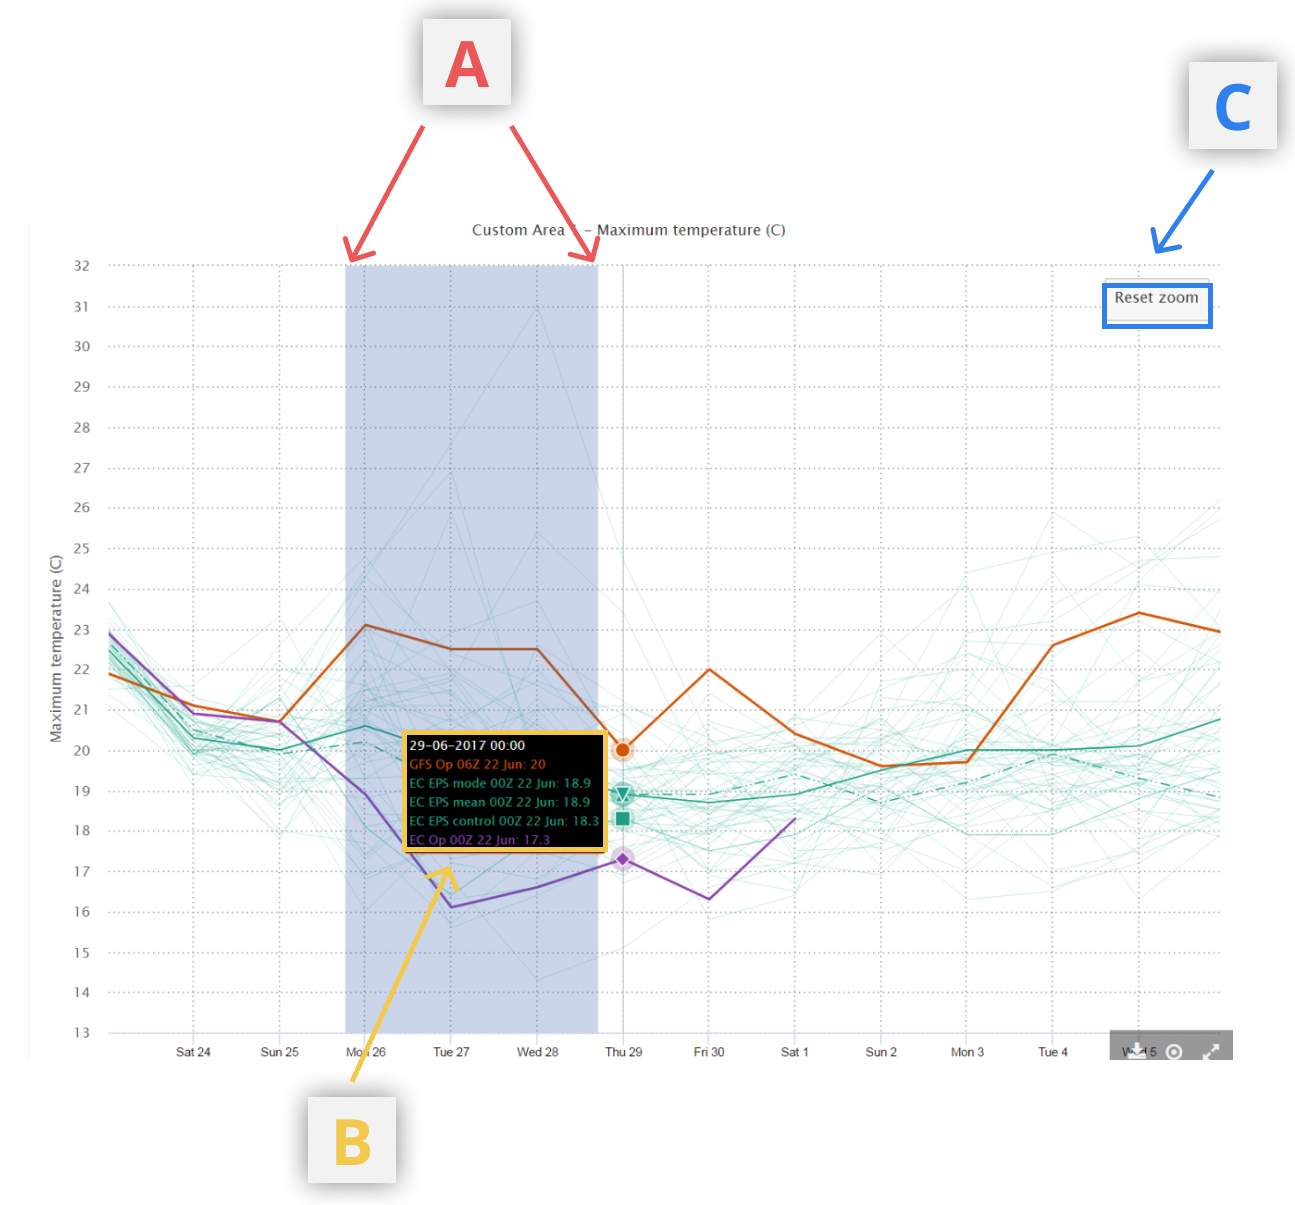
A. Zoom in
To restrict the temporal boundaries of the graph, click at the position of the start date/time and drag towards the desired end date/time.
B. Tooltips
When hovering over the graph, these give numerical values for selected model runs at the date/time the mouse is positioned at.
C. Reset Zoom
Back to default view (or to that selected in the xmin/xmax settings in the panel)
¶ 4) Toolbar
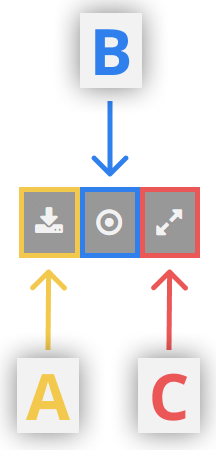
A. Download Data
Download the raw data from the graph in csv format
B. Toggle tooltips on/off
C. Full screen