MAGMA Tables include maximum, minimum and average temperature forecasts for various cities/locations around the world using data from MetDesk’s in house forecasting system, MAGMA (MetDesk Area Gridded Model Architecture). Temperatures are shaded to show how they compare with the climate average.
MAGMA uses operational and ensemble output, real time and historic observations, MDCM (MetDesk’s in-house climate model), predictive and type radar, high resolution topographical and land-use GIS data, combined to produce the MAGMA forecast. MAGMA updates hourly using the latest observations and models, and forecasts for the next 15 days ahead.
The most significant updates to the tables will be when the ECMWF Operational and Ensemble runs have recently finished arriving (~0700/1900 and 0805/2005 UTC respectively). In addition to these, the tables update at around 30 minutes past each hour, taking into account the latest data, including observations. In the majority of cases, changes at these times will be likely be less significant.
¶ 1) Panel
In this section users can:
- Toggle between Average and Maximum/Minimum temperature displays.
- Toggle between selectable regions.
Within each region are individual countries that can be selected under the "Areas" list.
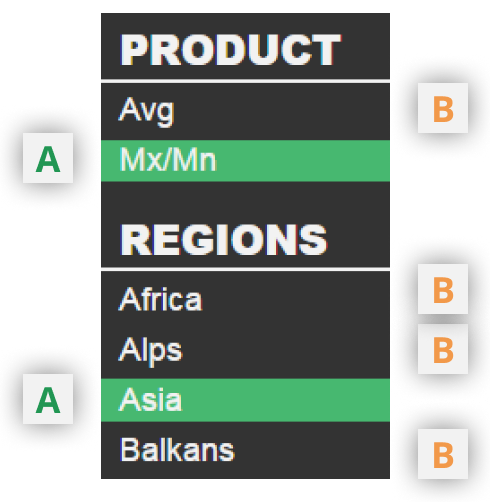
A. Selected option
B. Available but unselected option
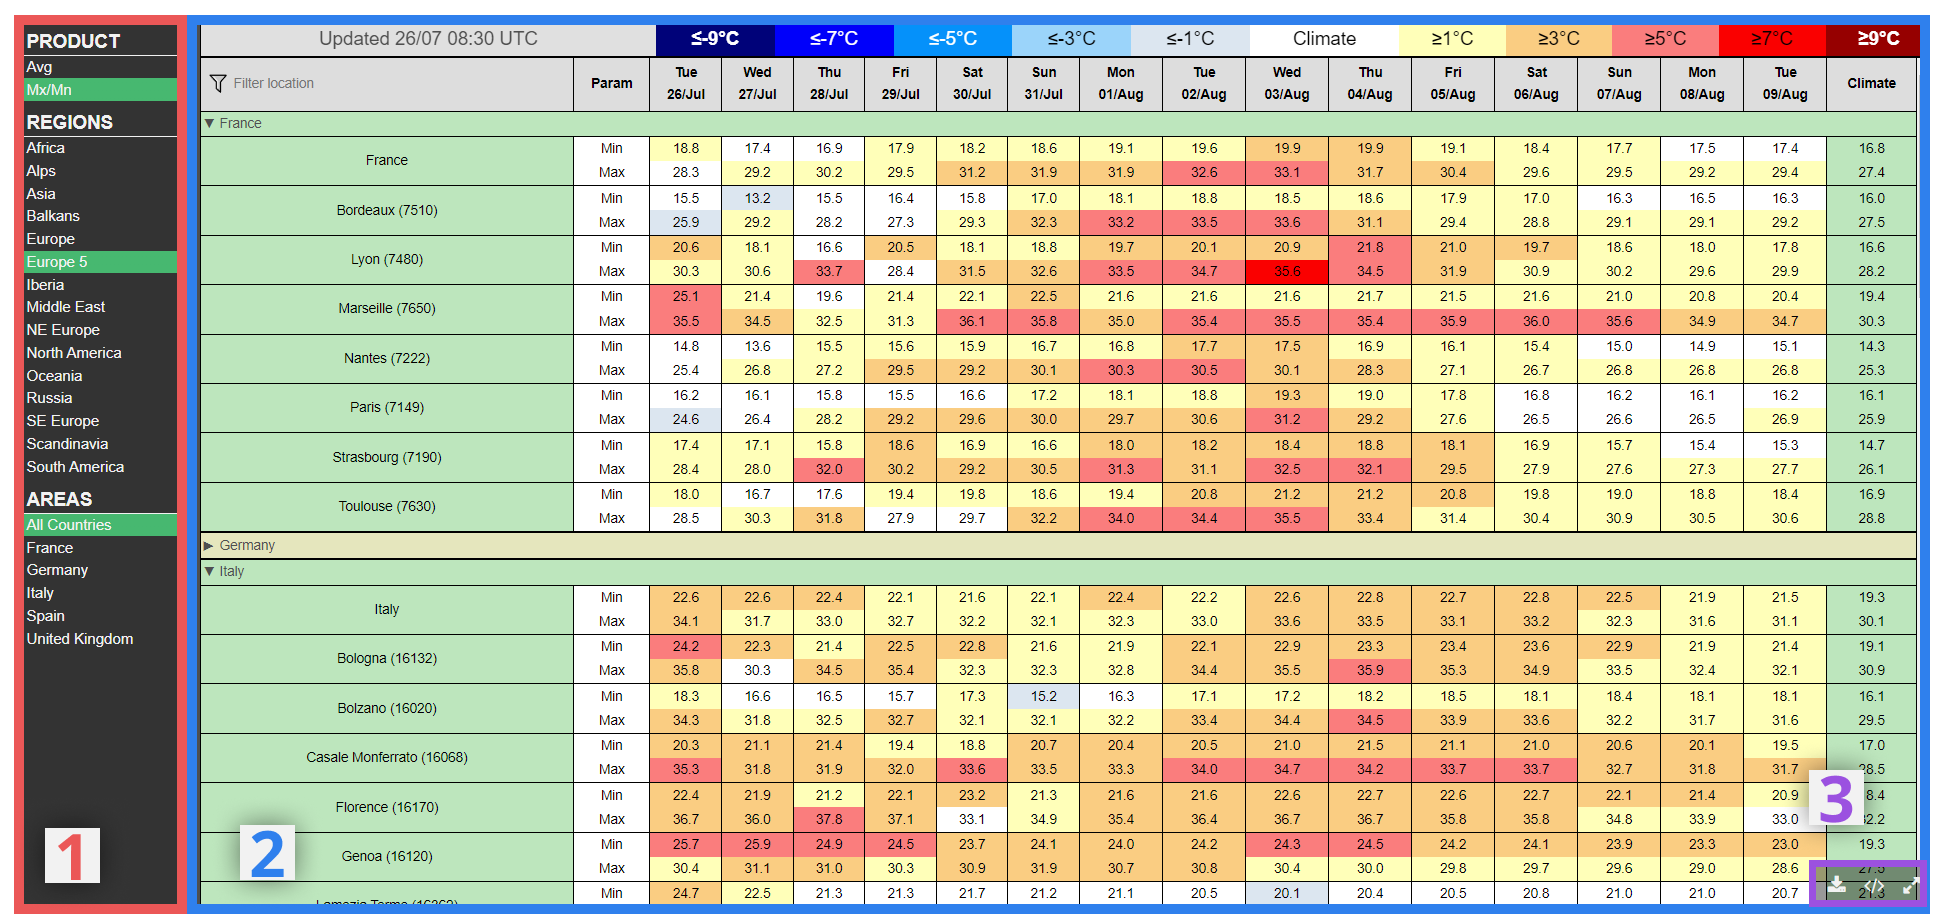
¶ 2) MAGMA Table
Within the main panel of this product, the MAGMA table itself is positioned.
On the left side of the table, the list of countries and sites are shown.
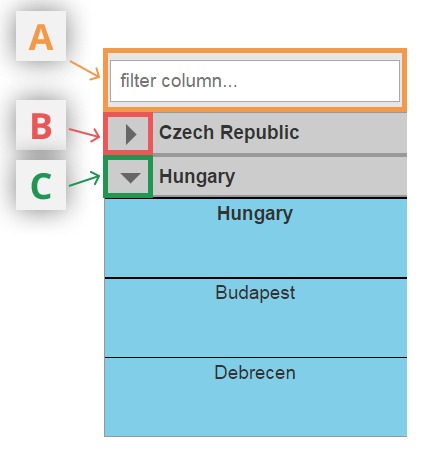
A. Search for locations within the current country/region selection
By typing in this box, those sites or countries matching the text are shown in the table and other sites hidden.
B. Minimised country with its cities hidden
Select to expand
C. Expanded country with all cities/locations shown
Select to minimise
When the Mx/Mn product is selected (i.e. when there is a separate maximum and minimum temperature forecast displayed for each site):
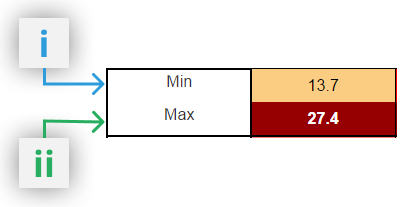
i. Minimum Temperature at location on the morning of the shown day i.e. the lowest temperature between 18z the previous day and 06z on the current day.
The forecast minimum temperature is replaced by the actual value beyond 06z.
The coming night's minimum temperature is shown in the next column
ii. Maximum Temperature at location on the day shown i.e. the highest temperature between 06z and 18z on the current day.
The forecast maximum temperature is replaced by the actual value beyond 18z.
¶ 3) Toolbar

A. Download data (raw csv)
Select to download the data from the currently selection in csv format
B. Download data (xml)
Unlike option A, this data format is more easily viewed with styling in spreadsheets
C. Full Screen
View the current table in full screen mode.
Once in full screen, this button will enable a return to the default view