With weather data streaming in from all corners of the globe, the observations map product enables the user to see up to date information on key weather parameters, as well as tracking the changes in parameters at a site-specific level over the last 7 days.
The controls and UI are slightly different to many of the other products on Trading Weather but the overall view is similar.
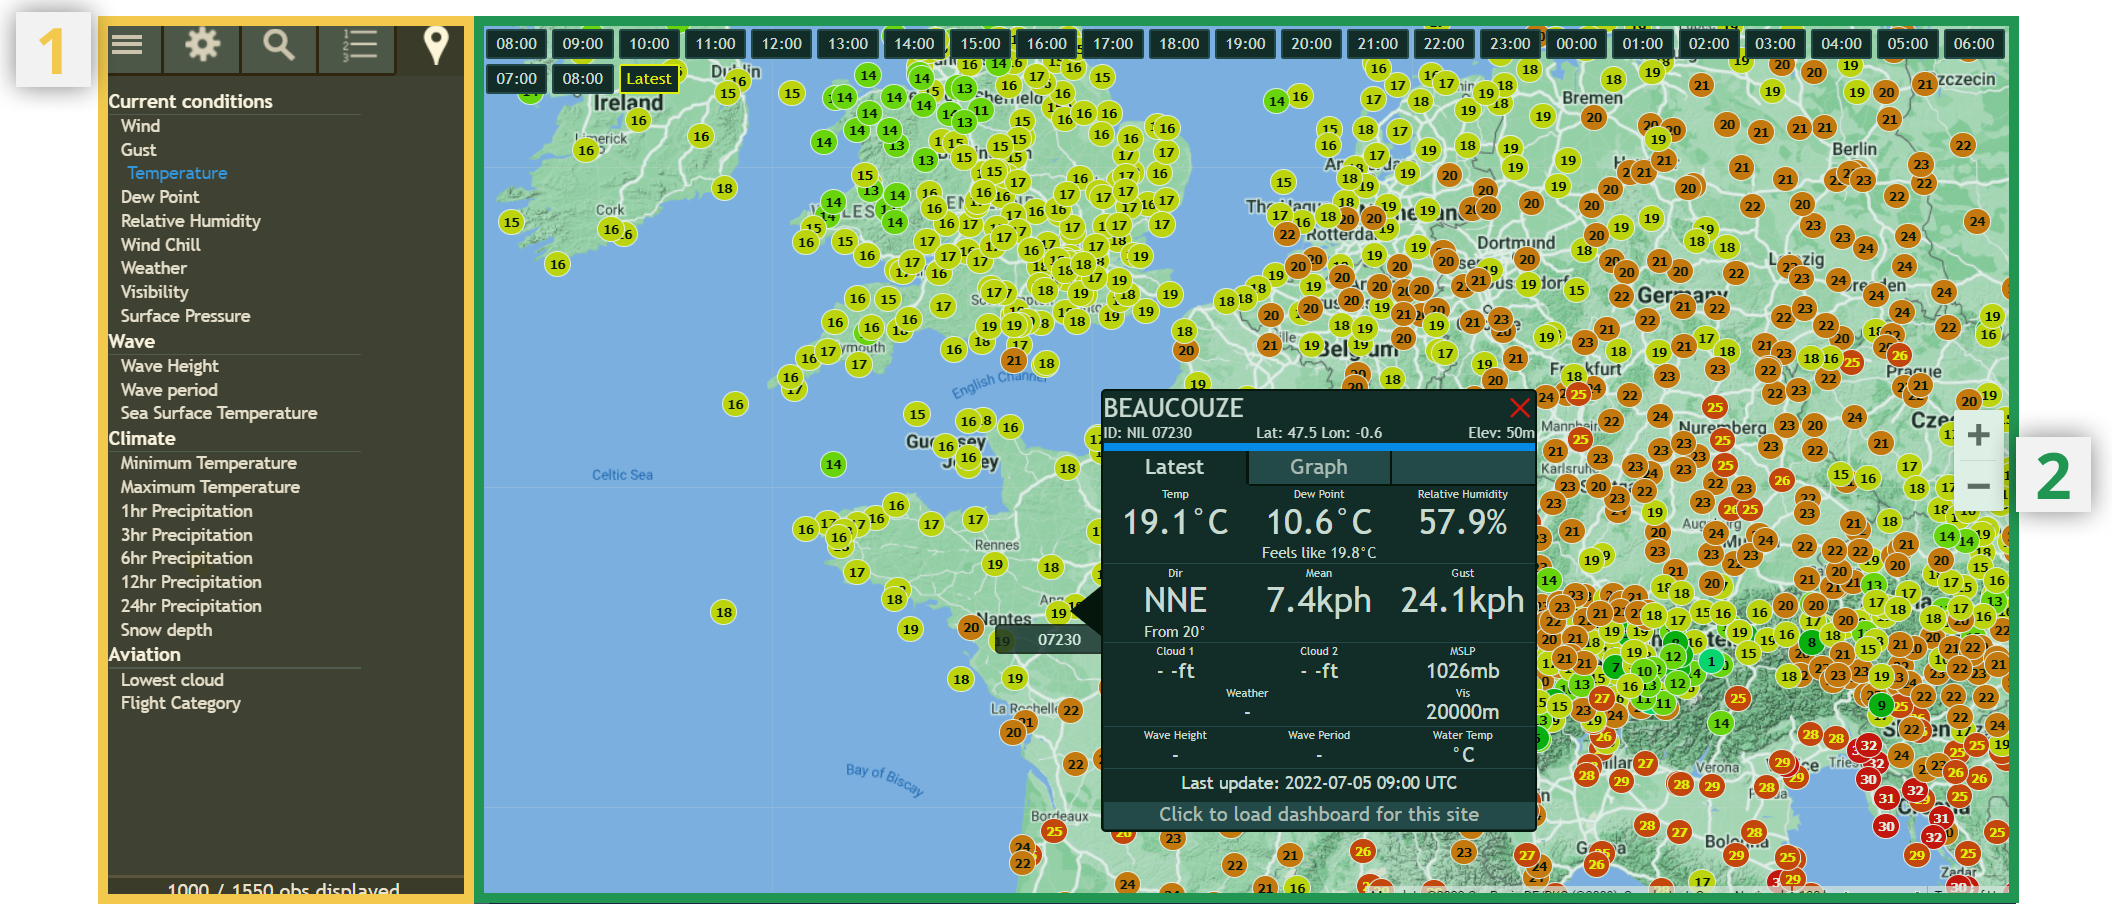
¶ 1) Toolbar + Options Panel
This area of made up of the toolbar, which contains five buttons, and the options panel below this. Clicking on the various buttons in the toolbar then effects the display in the Options Panel.
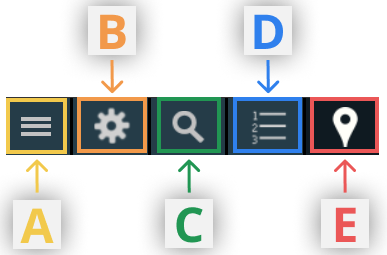
A. Show/hide the Options Panel below
B. Settings
Here the user can change many different settings relating to the data displayed on the observations map. The scientific units for each of the weather parameters can be changed and various the preferences for viewing the data. Click 'Save' at the bottom of this page to remember the chosen settings.
C. Location Search
Type a location in the search box and press enter to move the map to be centred on this location. A red marker then is displayed on the map. Alternatively, click one of the preset regions of the globe (e.g. NE USA, India, Europe) to centre the map over this area.
D. Top/Bottom 20 Observations
A list of the highest/lowest observations displayed in the current map view for the currently selected parameter is listed here. Click the arrow above the list to toggle between the top and bottom of the list.
E. Parameter Select
Choose the data to be displayed on the map, including choices between parameters such as temperature, wind speed, pressure etc.
¶ 2) Map Panel
The observations map itself is in this part of the page. Pan around the globe using the mouse.
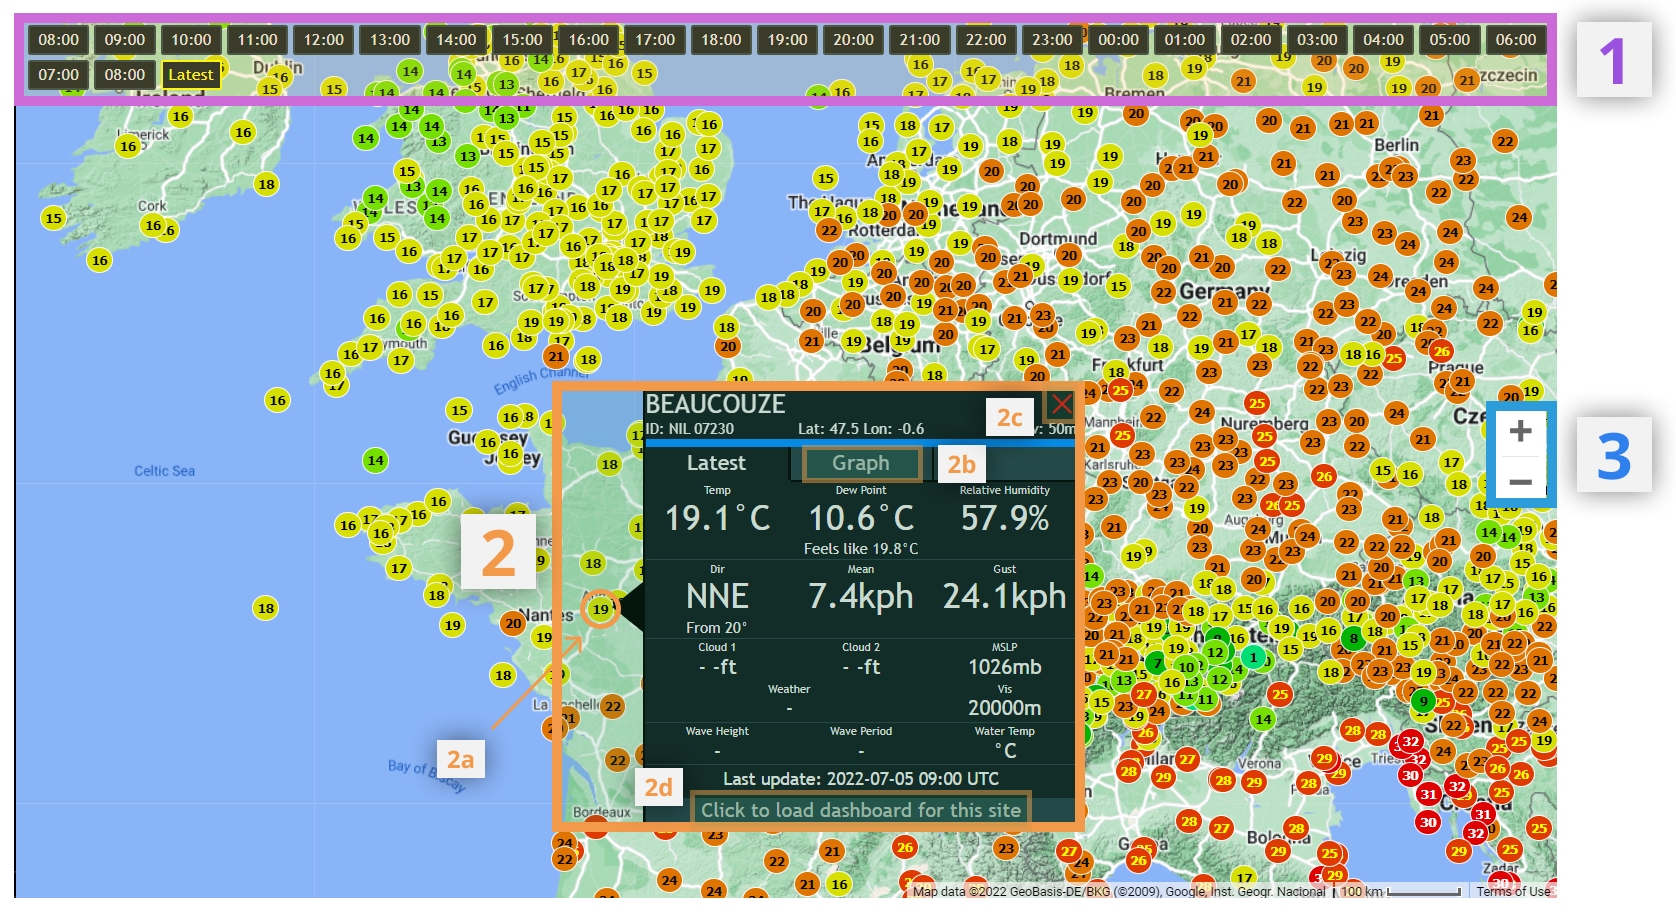
¶ 1. 24hr Archive
Buttons for each of the last 24 hours are displayed at the top of the page. By default, the latest data for the chosen parameter is shown, but by clicking any of the last 24 hours, a snapshot of weather conditions at that time step are then displayed on the map.
¶ 2. Specific site data
Clicking on any of the sites displayed on the map (2a) will bring up a box with all the data for that site at the current time step. From this point, the user can then select the graph tab (2b) to display the last 24 hours of data for that site in graphical form. A full-screen dashboard containing data in graphical and tabular forms from that chosen site over the past 7 days can be seen by selecting the option (2d) at the bottom of the box. The box can be closed using button 2c.