The Regime Viewer product provides a concise graphical analysis of model probabilities of the various weather pattern type regimes in the forecast outlook period.
All weather model output for a given time step, including each ensemble member, is classified according to its pressure pattern and assigned one of six regimes:
- Scandinavian Block (Scandi Block)
- Atlantic / UK Ridge
- North Atlantic Oscillation Negative Phase (NAO -ve)
- North Atlantic Oscillation Neutral Phase (NAO Neutral)
- Atlantic / UK Cyclonic
- North Atlantic Oscillation Positive Phase (NAO +ve)
With this consolidated data, the percentage of ensemble members within each regime is then displayed as a relative frequency bar graph. This user can can assess the probability of a certain regime taking place at various forecast horizons.
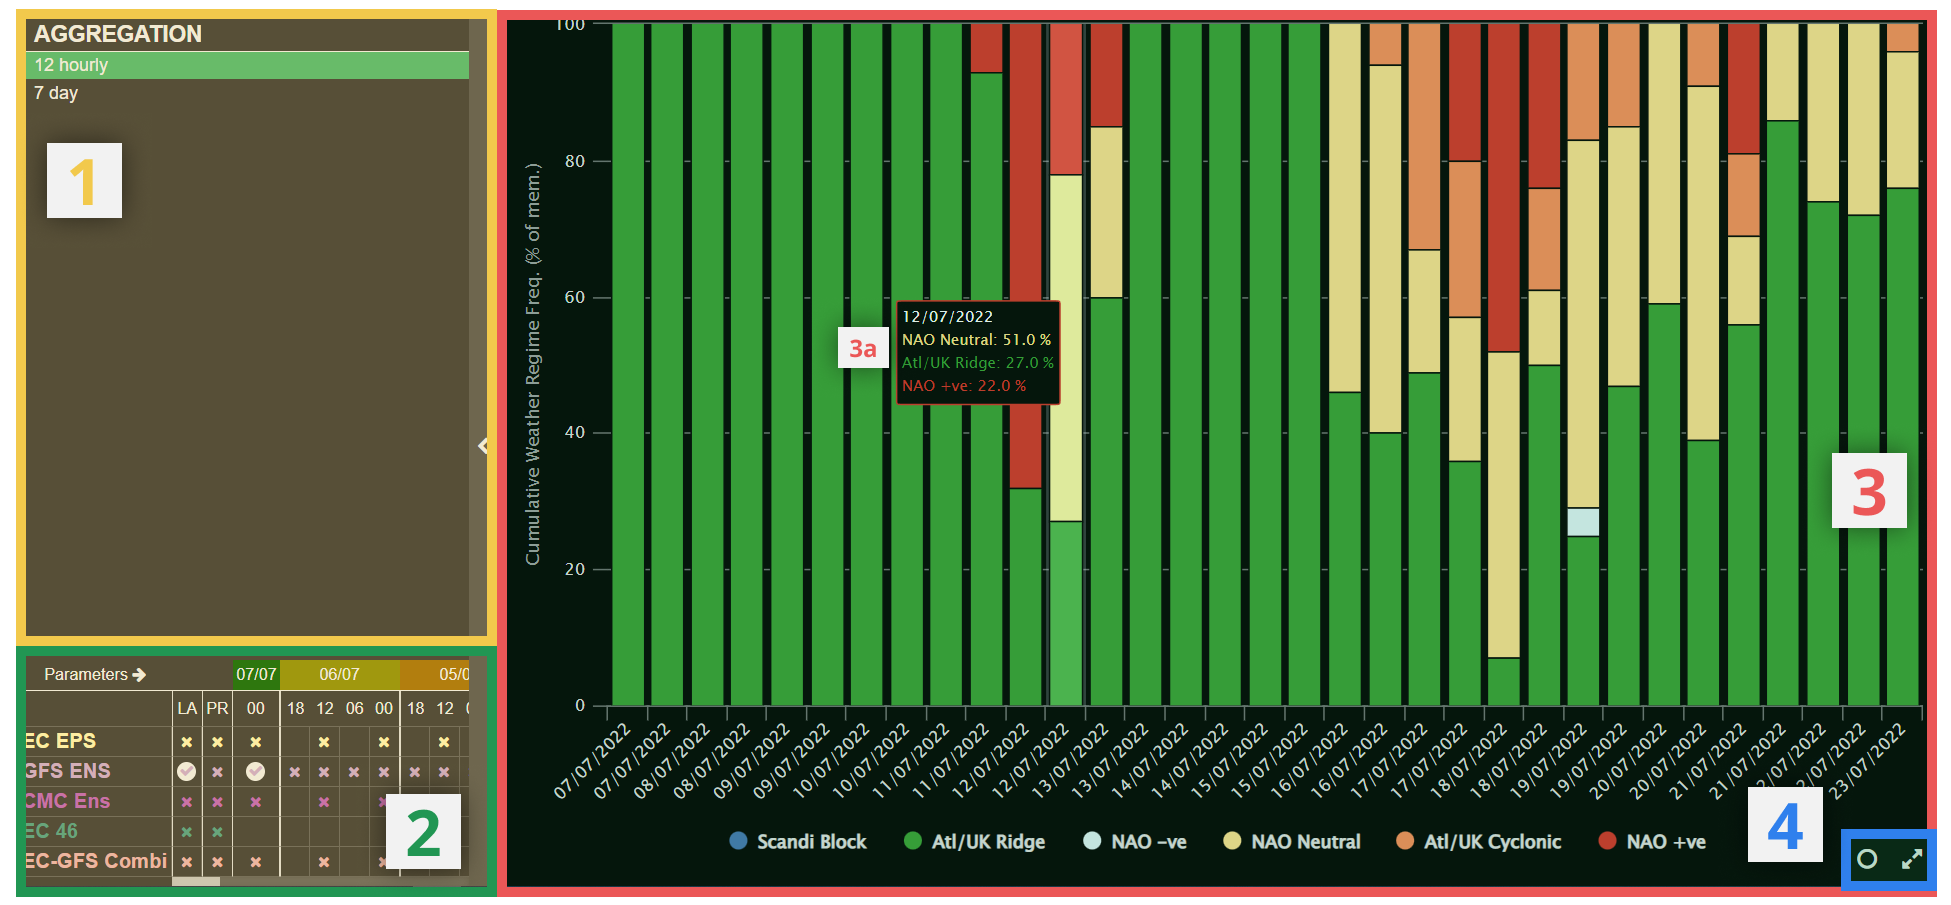
¶ 1) Options Panel
Switch here between aggregating the regimes into 12 hour or 7 day periods.
When the 7 day aggregation is selected, the date below each bar signifies the date at the start of that 7 day period.
¶ 2) Model Matrix
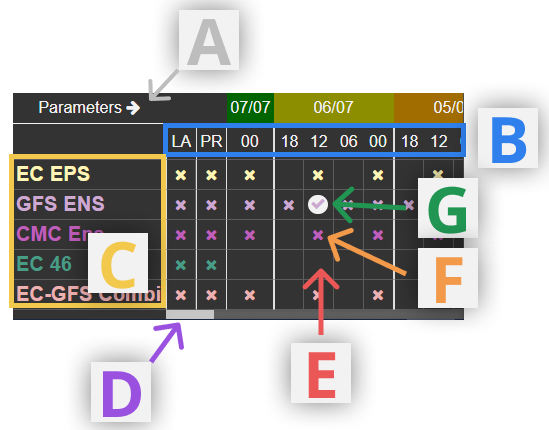
A. Expand matrix to include model runs back to 7 days
B. List of available model runs
Some models are not available at each time given. "LA" selects the latest available run for a given model. "PR" selects the model run before the latest available for a given model. Selecting "LA", "PR", or any of the available model run times will display all available data for that time.
C. List of available models
Selecting a model here will display the most recent two model runs
D. Scroll back to older model runs
E. Example of model run unavailable
F. Example of unselelected but available model run
G. Example of selected model run
¶ 3) Chart Area
Assuming the option is turned on (4A), then hovering up any of the bars in the chart will display tooltips (3a) with the relevant percentages for each regime at a given time interval.
¶ 4) Toolbar
.png)
A. Toggle tooltips (3a) on/off
B. Full screen