The TARGET (Teleconnection And ReGime Evaluation Tool) is Trading Weather's hub for teleconnection index data. It brings the user extensive data analysis options, providing country-level composites and exceedance probilities relating to the main teleconnections and weather regimes types. TARGET can thus bring an alternate view to the standard suite of models and help build risks against certain trading positions.
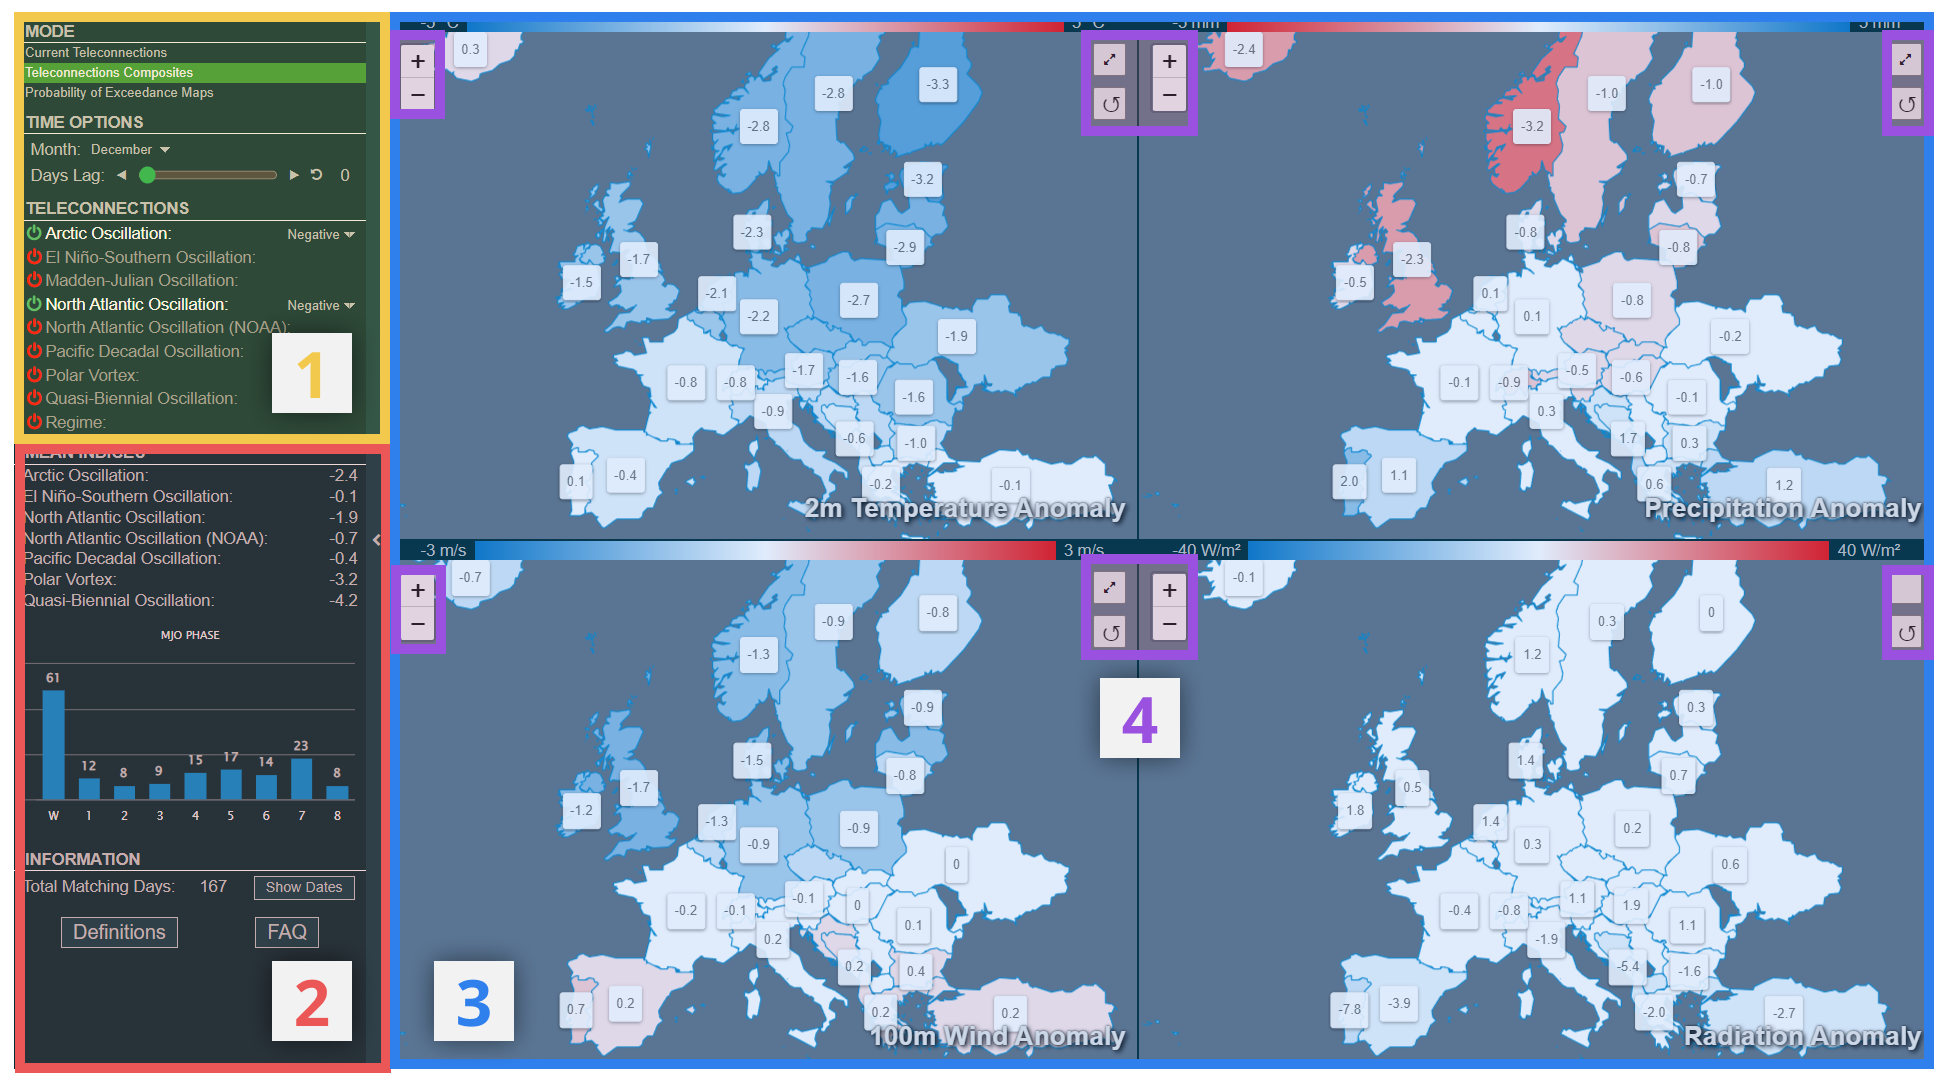
¶ 1) Data Selector Panel
Here, the user selects the data which is displayed in the chart panel.
¶ Modes
There are three 'modes' to TARGET:
- Current Teleconnections
- Teleconnections Composites (TC)
- Probability of Exceedance (PoE)
Firstly, the user can select 'Current Teleconnections' to have a daily-updated list of the current values / states of each of the teleconnections used in TARGET. In this mode, there is little or no additional functionality to decribe.
The remaining two modes (TC and PoE) require more user interaction to display the required data. The ways to select the data in this panel and the information in the Information Panel (2) do vary slightly between the these two modes.
¶ Time
Initially, the user must select the time period from which the data should be displayed.
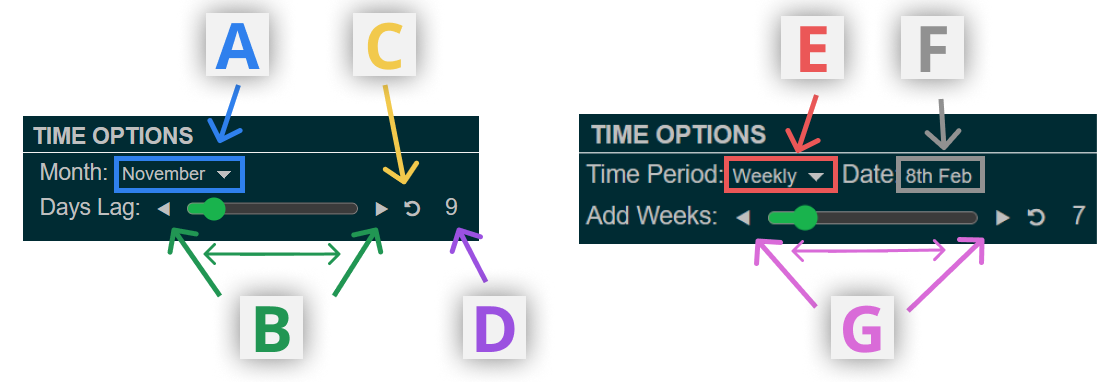
A. Month Select (TC)
Select the month from which is display data for.
B. Days Lag (TC)
Drag the slider of use the arrow buttons to increase/decrease the number of days lag effecting the data. Data displayed in the maps will be composites for the days moved forward in time with the chosen parameters and month.
C. Reset (TC + PoE)
Reset the number of days lag (TC) or future interval period (PoE) to zero.
D. Slider Value (TC + PoE)
Displays the value of the currently selected number of days lag (TC) or future interval period (PoE)
E. Period Select (PoE)
Toggle between Daily, Weekly or Monthly intervals for selecting the intervals over which exceedance probability will be calculated
F. Date Select (PoE)
Select the starting date (where the initial teleconnection parameters are valid for) from which the future interval period is moved on from
G. Interval Select (PoE)
Select the number of days, week or months (choice selected using dropdown E) into the future for which probabilities are displayed beyond the initial date (selected using F)
¶ Parameters
In addition to selecting the time periods, the user may also select which teleconnections or indices to be used in the background data used for composites or probabilities.
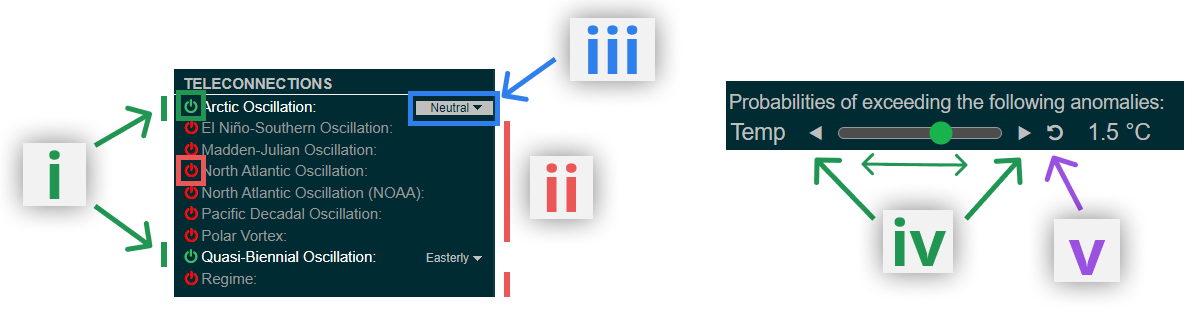
Using the highlighted button on the left hand side of the teleconnections list, the user can toggle on/off each of the indices. At least one must be chosen in order for data to be displayed, while several at once can be chosen (although noting that the sample size for the data behind the composites will decrease as the number of selected indices increases).
i. Teleconnection Included
ii. Teleconnection Not Included
iii. Teleconnection State Select
When a particular teleconnection is selected (turned on / included), a dropdown box appears allowing the user to choose the state of the teleconnection to be used in the data selection (e.g. to choose whether dates with Arctic Oscillation positive, neutral or negative values are included).
(PoE Only)
iv. Anomaly Threshold Select
Here, the user selects the anomaly threshold for which the probabilities of exceedance are calculated
v. Reset
Reset any user-altered anomaly thresholds to the default of 0.
¶ 2) Information Panel
This panel to the bottom-left of the product shows information on the data selected in the Data Selector Panel (1). For the Teleconnection Composites mode, the mean values of the teleconnection indices for the included matching days are displayed, along with a chart displaying the number of days which have each of the phases of the Madden Julian Oscillation (MJO).
For both modes, there is also a count of the number of days that match the conditions defined in (1), effectively describing the sample size of the composites or probabilities displayed in the maps/charts.
¶ Matching Days Anomaly Maps
Selecting the option 'Show Dates' brings up a large additional panel displaying reanalysis data from each of the dates which match the parameters selected in (1). Daily anomalies in geopotential heights, temperatures, wind, precipitation and solar are displayed for each of these dates.
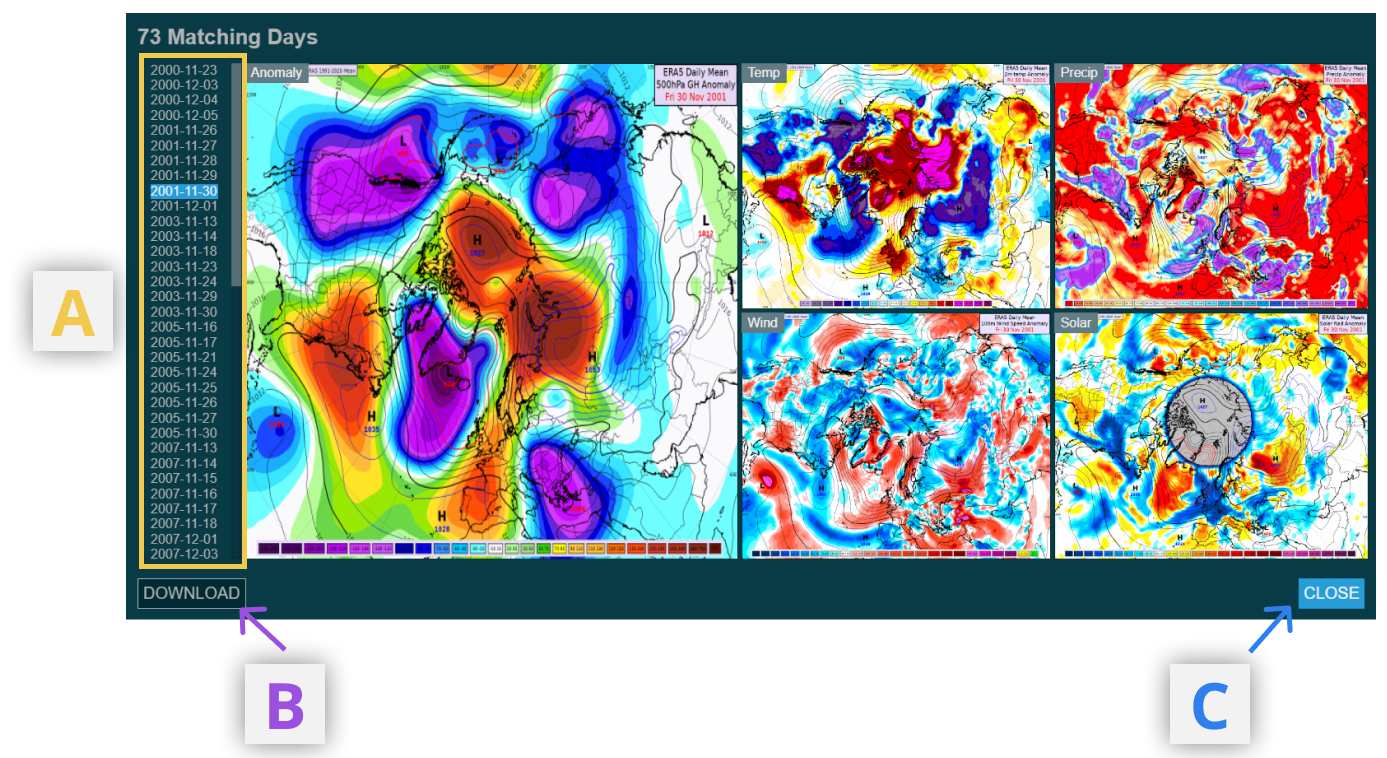
A. Date Select
Scroll through a list of the applicable dates (that match the constraints in (1)). Select the date to view the anomaly maps for that day.
B. Download Dates
Download a .txt file with the relevant dates listed
C. Close
Close this anomaly map panel and revert back to the default product view
Finally, at the bottom of the information panel, there are buttons to view our definitions of the thresholds for each teleconnection index and a set of more technical frequently asked questions.
¶ 3) Chart Area
Four different maps are shown in the main chart area of the product, one for each of four weather parameters included: temperature, precipitation, wind and radiation.
Here, either country-level anomalies (TC) or country-level probabilities are shown in each of the maps. The countries themselves on the maps are shaded according to their values on a fixed scale.
Using the full screen option in the toolbar (4, see below), one of the maps can be made to cover the whole of the chart area.
Using the mouse to hover over a particular country will bring up an information box in the bottom-left of that particular map.
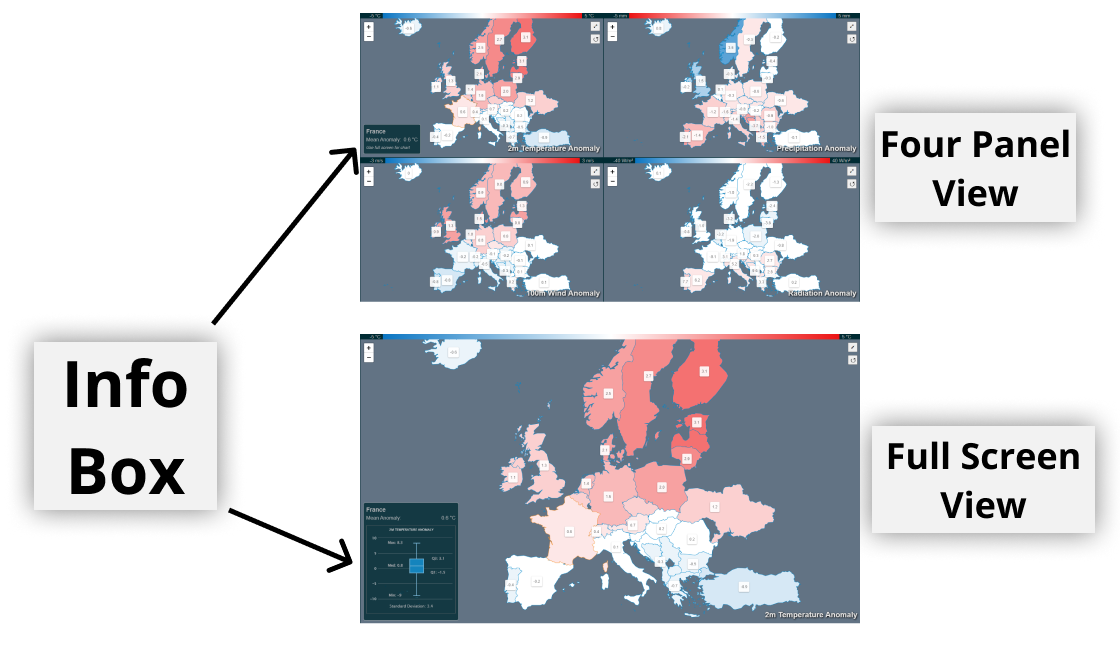
The information displayed in this box varies between whether the four-panel or full screen view is being utilised. In the full screen view, additional data is displayed in the information box, including a box and whisker plot, and further statistics on the data for that country.
¶ 4) Toolbars
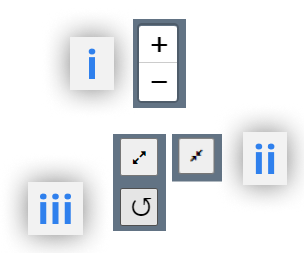
i. Zoom In/Out
Use this buttons (or a mouse wheel) to zoom in and out of the charts. In the four panel view, zooming in one chart will do the same in the other three.
ii. Full Screen Toggle
Enter or exit full screen mode, when one of the charts covers the whole screen, in place of the default four-panel view.
iii. Reset Screen View
This option resets the zoom of the map to the default level