Wind and solar output forecasts for countries or TSOs, based on data from various models including ECMWF, GFS, CFS and UKMO, which feeds into our sophisticated in-house model. These forecasts are updated in real time as new model data becomes available.
For a full training course on market-relevant wind phyiscal processes, please see here:
https://energytraining.metdesk.com/courses/fundamentals-wind
¶ 1) Panel
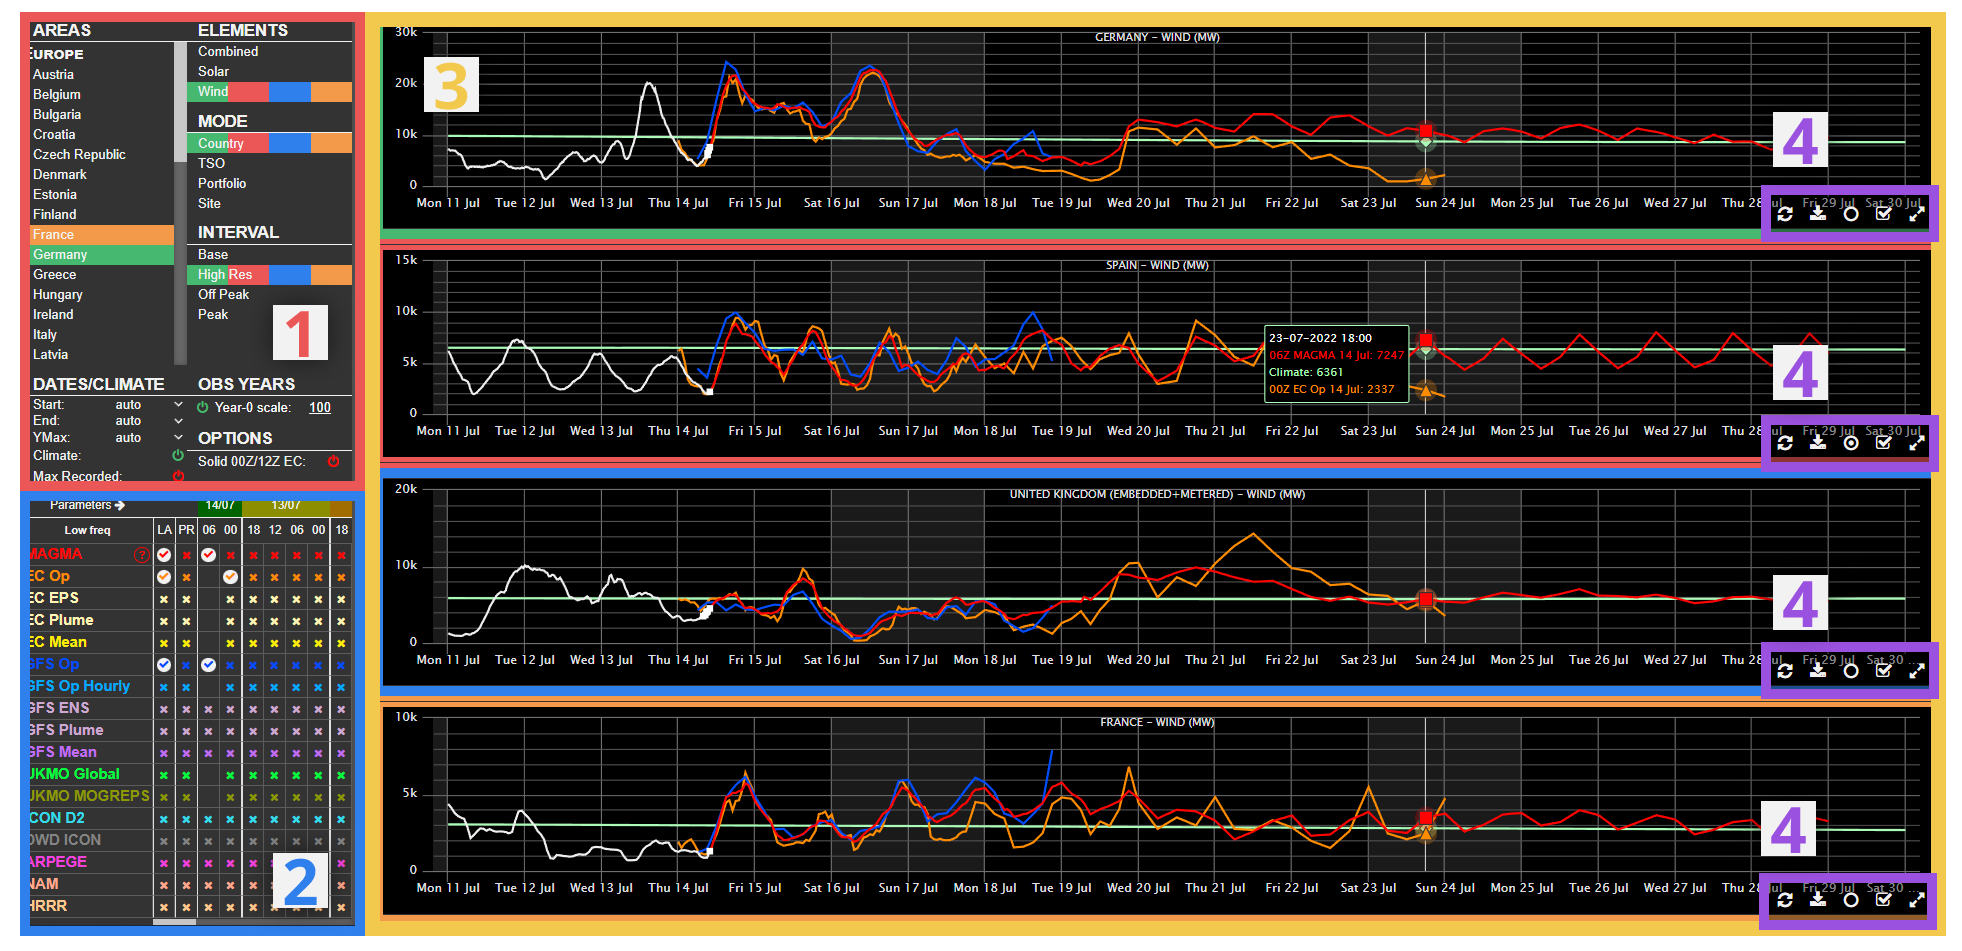
The panel to the top-left of the screen allows the user to make adjustments to the content on the graphs. As default, changes made in the panel will alter all four of the graphs shown on the page, but changes to individual graphs can be made by first selecting the desired graph(s). This can be done by using the relevant button in the toolbar (see section 4), or by clicking anywhere on the graph area. Each of the graphs are colour coded, so it is easy to see which settings are selected for each graph in the panel.
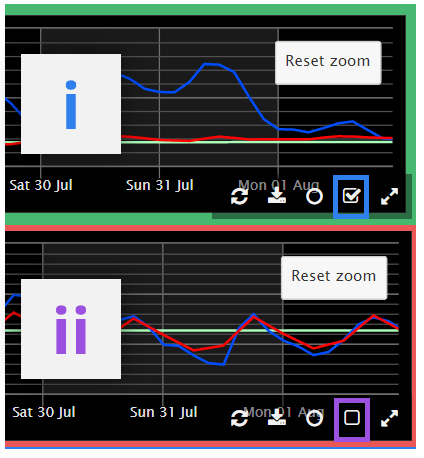
i. Selected graph
Note ticked box in toolbar and thicker coloured outline to the graph
ii. Unselected graph
Note unticked box in toolbar and default thickness of coloured outline
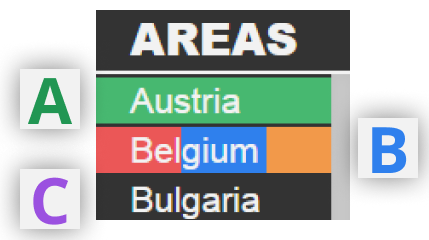
A. Option selected by graph 1 (top, green outline) only
B. Option selected by graphs 2,3,4 (red,blue,orange)
C. Option available but not selected on any graphs
The available settings to be changed in the panel are as follows:
-
Areas - Select area/location for power forecast (switch between different spatial scales of location in the 'Mode' option.
-
Elements - Toggle between solar power, wind power, or a combination of both
-
Mode - Switch between different scales of power forecast, from country-wide to site specific. Updating this option will change the 'Areas' available under that menu option.
-
Interval - Select how the data is display i.e. high resolution power output or in terms of day-averaged base or peak/off peak values
-
Start - Change the starting time on the x-axis (either automatic or in terms of days)
-
End - Change the ending time on the x-axis (either automatic or in terms of days)
-
Ymax - Change the maximum output on the y-axis (either automatic or limit in MW)
-
Climate - Turn on climatology line for the graph(s) corresponding to the location area/site
-
Max Recorded - Turn on a line showing the maximum recorded peak generation for the area/site selected.
-
Solid 00z/12z EC - Toggle on/off whether the latest full 00z/12z ECMWF runs or more recentrecent boundary condition runs are shown as solid lines on the chart. The boundary condition ECMWF runs are much more limited in forecast horizon than the main 00z and 12z runs.
-
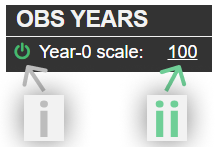
Obs Years - Display observations. Toggle on/off using (i) and adjust the scale of the observations by changing the number in (ii). 100 is the default number and shows the observations as reported. For example, use 110 to show observations 10% higher than reported, to account for increasing capacity for similar reasoning.
¶ Observations / Pseudo Observations
Where possible, actual values for wind and solar generation are made available on the power graphs.
Pseudo obs are used when there are no actual observations available.
This can be for a couple of reasons.
There are never observations available from the TSOs or Entso-e. Some countries, usually those with small installed capacities, never report data via TSOs or Entso-e and will never show a “real” observed value.
Occasionally there will be an interruption of the observations arriving at/from Entso-e. This can be for just a single observation point or for hours at a time.
Where data is missing MetDesk fills the observation with a psuedo value - this is denoted by a small square box so users can tell if the observation is real or Pseudo. The filling process simply and uses the nearest available MAGMA forecast as the pseudo value. Sometimes observations can be backfilled and made available to us at a later than usual time. Where this happens, the pseudo value is over-written by the real value.
.png)
¶ 2) Model Matrix
This compact matrix enables quick toggling on/off of model runs. As default, making changes in the matrix will affect all graphs, but selecting one or more graphs will enable the changes to be made to specific graphs only.
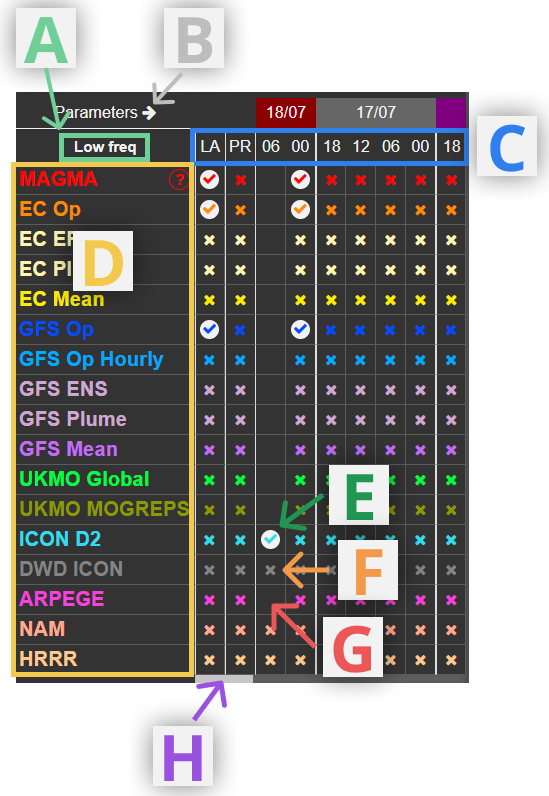
A. Toggle High/Low frequency
Click to switch between low frequency (multiples of 6 hours) or high frequency (greater resolution of model runs, down to hourly or 3-hourly model runs.
B. Expand matrix to include model runs back to 10 days
C. List of available model runs
Some models are not available at each time given. "LA" selects the latest available run for a given model. "PR" selects the model run before the latest available for a given model. Selecting "LA", "PR", or any of the available model run times will display all available data for that time.
MAGMA, our in-house model, updates on a rolling basis as new model data comes in. The most recent data is available using "LA" or the most recent hour in the matrix. Without changing the selection here, the MAGMA data will update frequently to adjust to new incoming data. Every 6 hours, the data from MAGMA runs are frozen and kept in the matrix.
When a new 6-hourly MAGMA run arrives in the matrix (e.g. "06"), then the data behind the previous MAGMA step displayed (i.e. the "00" in this case) is then frozen with the current MAGMA data. This occurs once the first set of model starts to arrive from that new step's initialisation time. Hence, for the example of the "06" MAGMA, this starts to appear when the first 06z models start to arrive, which may be around 09:00-10:00GMT, and the rolling updates to the "00" MAGMA run will then stop. Thus, data arriving after 06:00GMT (including the ECMWF EPS 00z for example) will often still be incorporated into the "00" MAGMA run stored in the matrix.
D. List of available models
Selecting a model here will display the most recent two model runs
E. Example of selected model run
F. Example of unselelected but available model run
G. Example of model run unavailable
H. Scroll back to older model runs
¶ 3) Graph
There are two products available containing power graphs: one with a single graph and the other with four vertically stacked graphs. The user can make changes to the layout or add/remove graphs by utilising the dashboard feature.
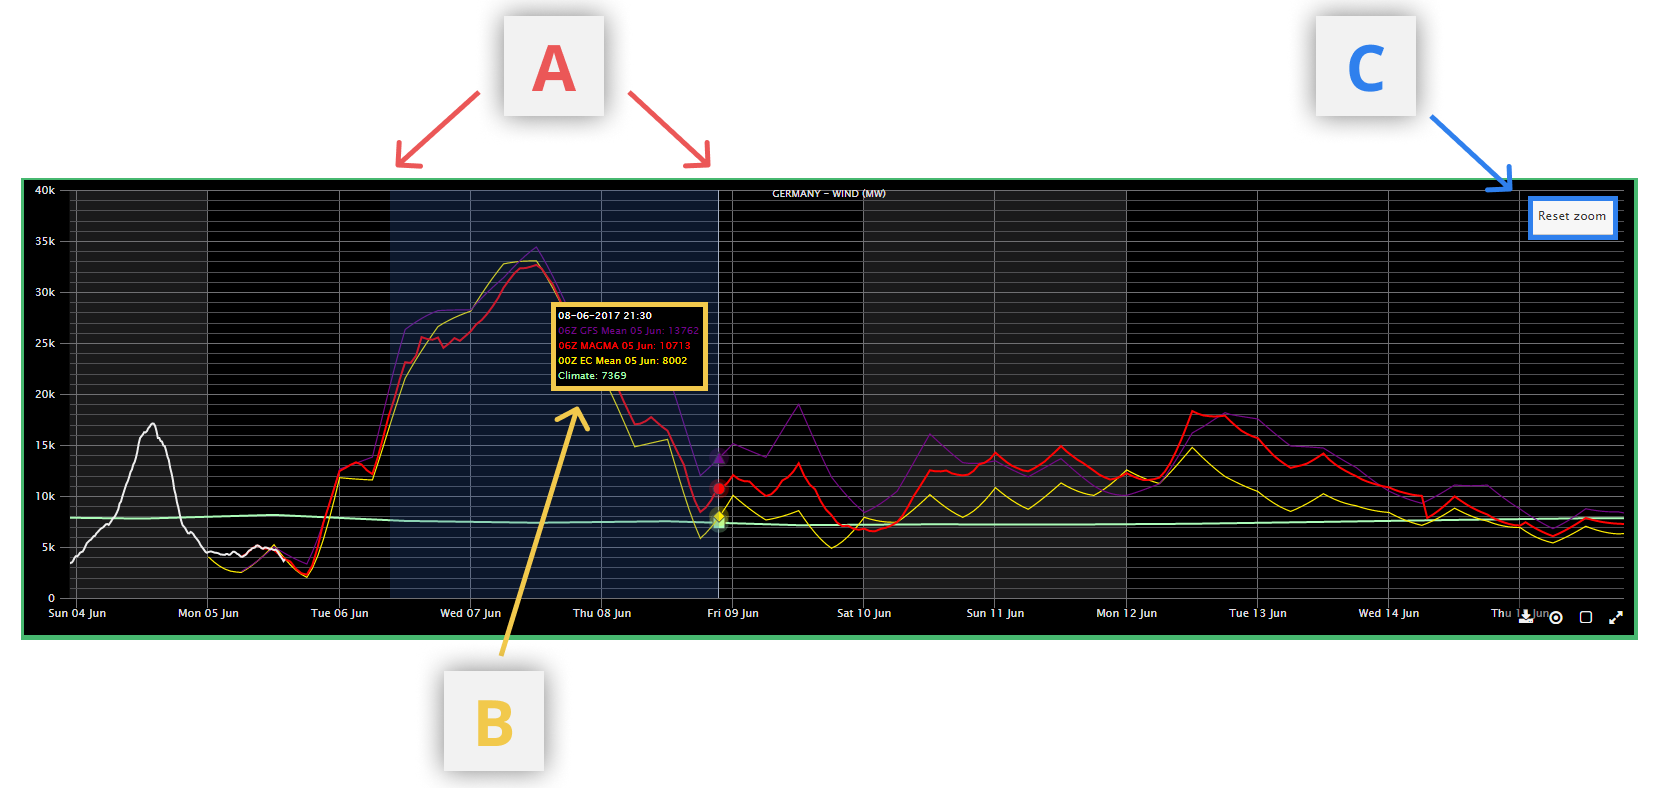
A. Zoom in
To restrict the temporal boundaries of the graph, click at the position of the start date/time and drag towards the desired end date/time.
B. Tooltips
When hovering over the graphs, these give numerical values for selected model runs at the date/time the mouse is positioned at.
C. Reset Zoom
Back to default view (or to that selected in the xmin/xmax/ymax settings in the panel)
Solid lines on the graphs represent the most recent run from a given model, whereas dotted/dashed lines are older runs.
¶ 4) Toolbar
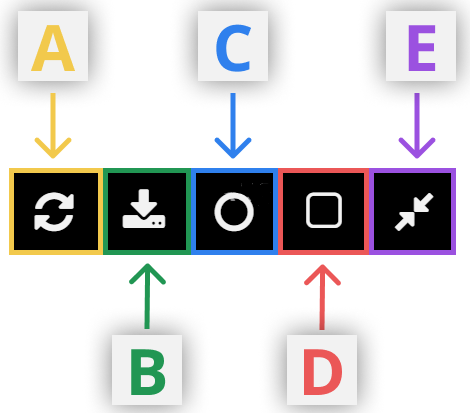
A. Refresh
Select to refresh the data on the graph. Data will auto-refresh as it comes in too.
B. Download Data
Download the raw data from the graph in csv format
C. Toggle tooltips on/off
D. Select/Unselect to make changes to just one graph
This can also be done by clicking anywhere on the graph area
E. Full screen