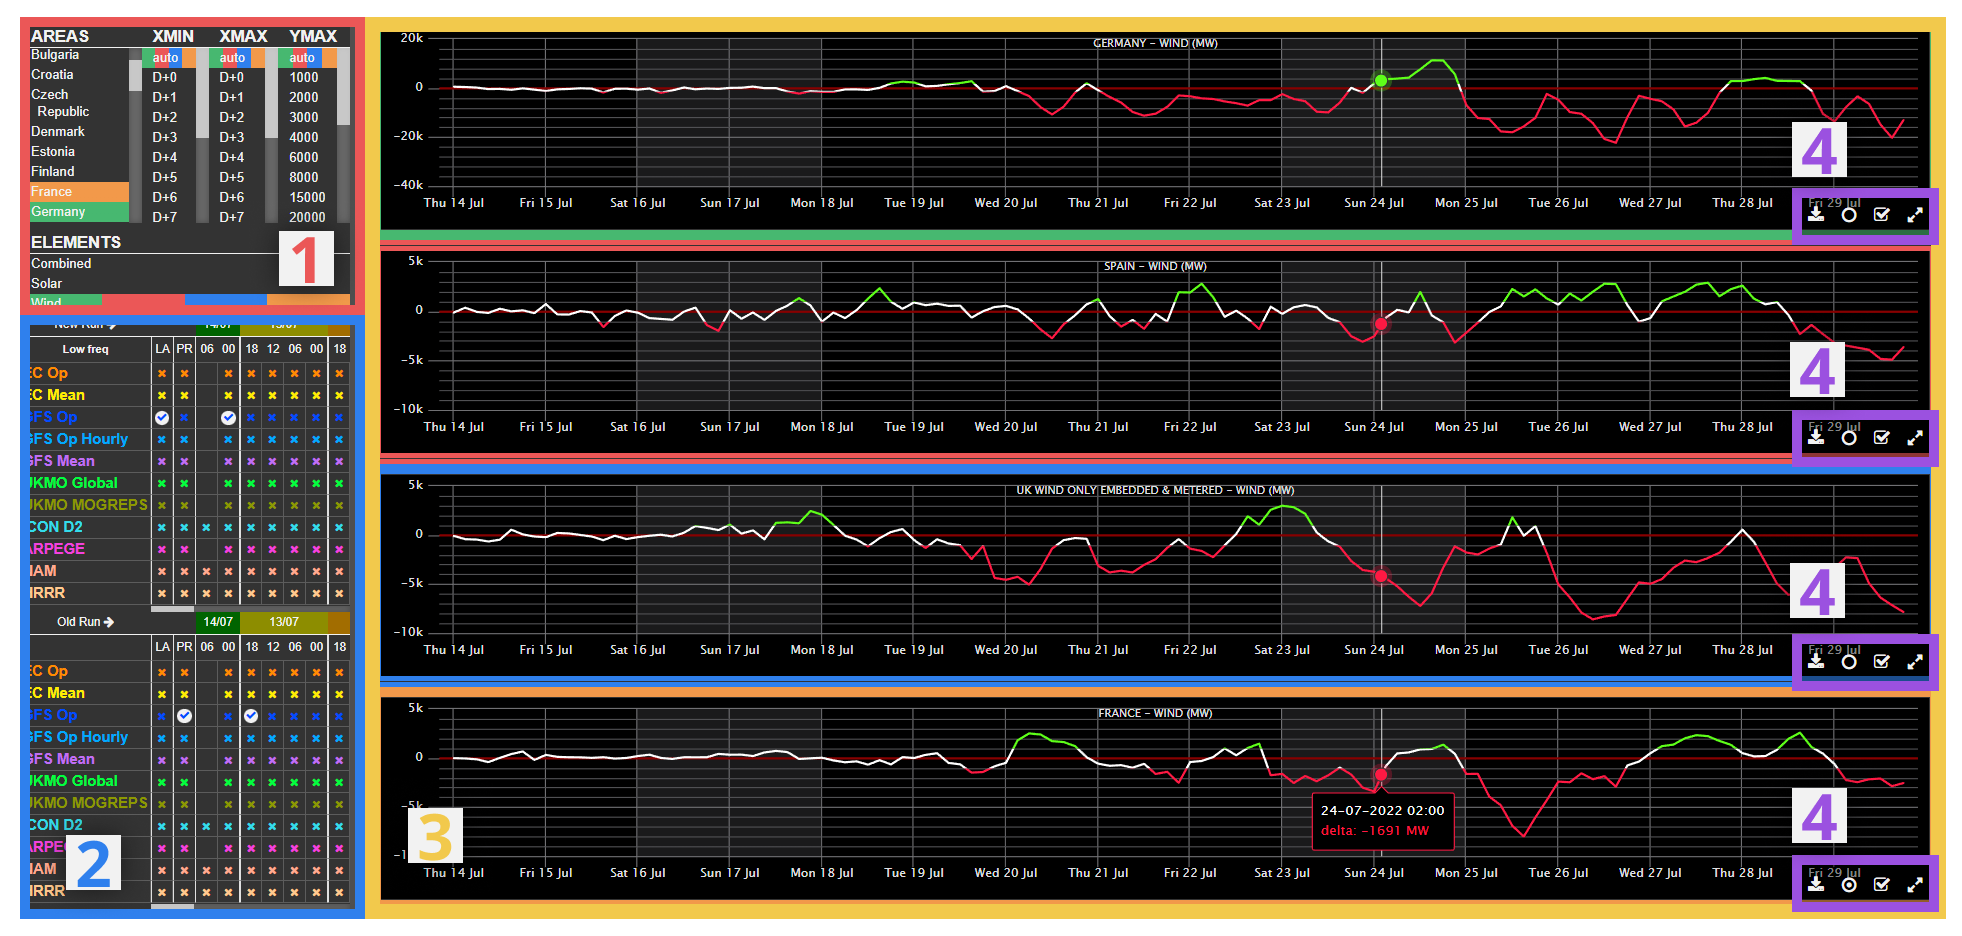
This product is a graphical diplay of hourly power (wind and solar) output forecast data, using various models, for a large selection of European countries. The delta can be used to compare between two runs of the same model or to compare between different models. Significant deltas are highlighted in green (increase) or red (decrease). The graphs build live as latest model data comes through.
There are two forms of this product: one with four charts displayed (Power Delta) and one with a single chart (Power Delta Single).
¶ 1) Panel
The panel to the top-left of the screen allows the user to specific the required content on each of the four graphs. It is possible to make changes to individual or multiple graphs by first selecting the desired graph(s). This can be done by using the relevant button in the toolbar (see section 4), or by clicking anywhere on the graph area. Each of the graphs are colour coded, so it is easy to see which settings are selected for each graph in the panel. Adjusting either the graph dimensions or the element will affect all graphs as default is none are selected. At least one graph must be selected in order for the area/country to be changed.

A. Selected graph
Note ticked box in toolbar and thicker coloured outline to the graph
B. Unselected graph
Note unticked box in toolbar and default thickness of coloured outline

A. Option selected by graph 1 (top-left, green outline) only
B. Option selected by graphs 2,3,4 (blue,red,orange)
C. Option available but not selected on any graphs
The available settings to be changed in the panel are as follows:
Areas - Select country for power forecast
Xmin - Change the starting time on the x-axis (either automatic or in terms of days)
Xmax - Change the ending time on the x-axis (either automatic or in terms of days)
Ymax - Change the maximum output on the y-axis (either automatic or limit in MW)
Elements - Toggle between solar power, wind power, or a combination of both
¶ 2) Matrix
The matrix system allows users to select the source for the graphs. There are two matrices so that a comparison between two models or model runs can be made. The delta is calculated as the Matrix i Selection minus the Matrix ii Selection. If the matrices have the same selection, the delta will be zero and no plot will be shown on the graphs.
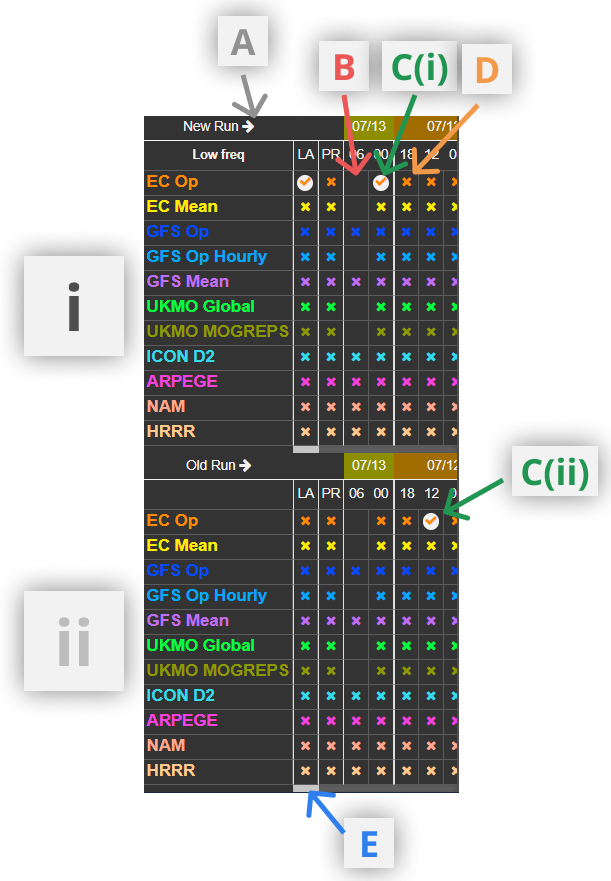
A. Expand matrix to include model runs back to 10 days
B. Unavailable model run
Some models are not available at each time given.
C. Selected model run
Those model runs available and unselected are marked with a cross
F. Available model run
An example of a model run that is available but not selected.
"LA" selects the latest available run for a given model.
"PR" selects the model run before the latest available for a given model
F. Scroll to view older model runs
¶ 3) Graphs
Graph plots will appear white in colour when there is no significant delta.

A. Zoom in
To restrict the temporal boundaries of the graph, click at the position of the start date/time and drag towards the desired end date/time.
B. Tooltips
When hovering over the graphs, these give numerical delta values for selected model runs at the date/time the mouse is positioned at.
C. Reset Zoom
Back to default view (or to that selected in the xmin/xmax/ymax settings in the panel)
¶ 4) Toolbar
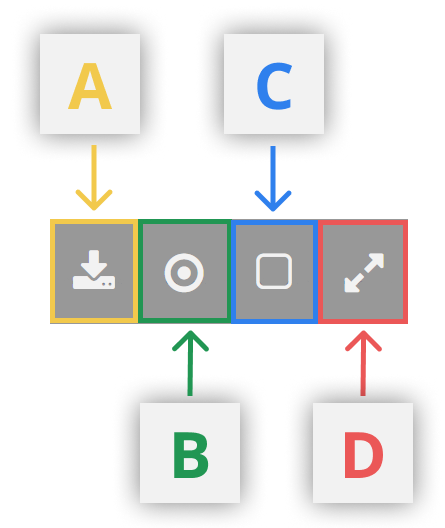
A. Download Data
Download the raw data from the graph in csv format
B. Toggle tooltips on/off
C. Select/Unselect to make changes to just one graph
This can also be done by clicking anywhere on the graph area
D. Full screen