This product displays hourly power output forecast data from various models in tabular form. These tables include absolute values and deltas with the option to compare between different model or model runs, in effect providing tabular data from the Wind/Solar and Wind/Solar Delta products.
Significant deltas are highlighted in green (increase) or red (decrease). The tables display wind, solar or a combination of both, as well as including an average temperature for the selected country as a proxy for demand.
There are two products available of this type on Trading Weather: one with table for one country (Power Tables Single) and one with two tables (Power Tables) for viewing two countries (or generation areas) simultaneously.
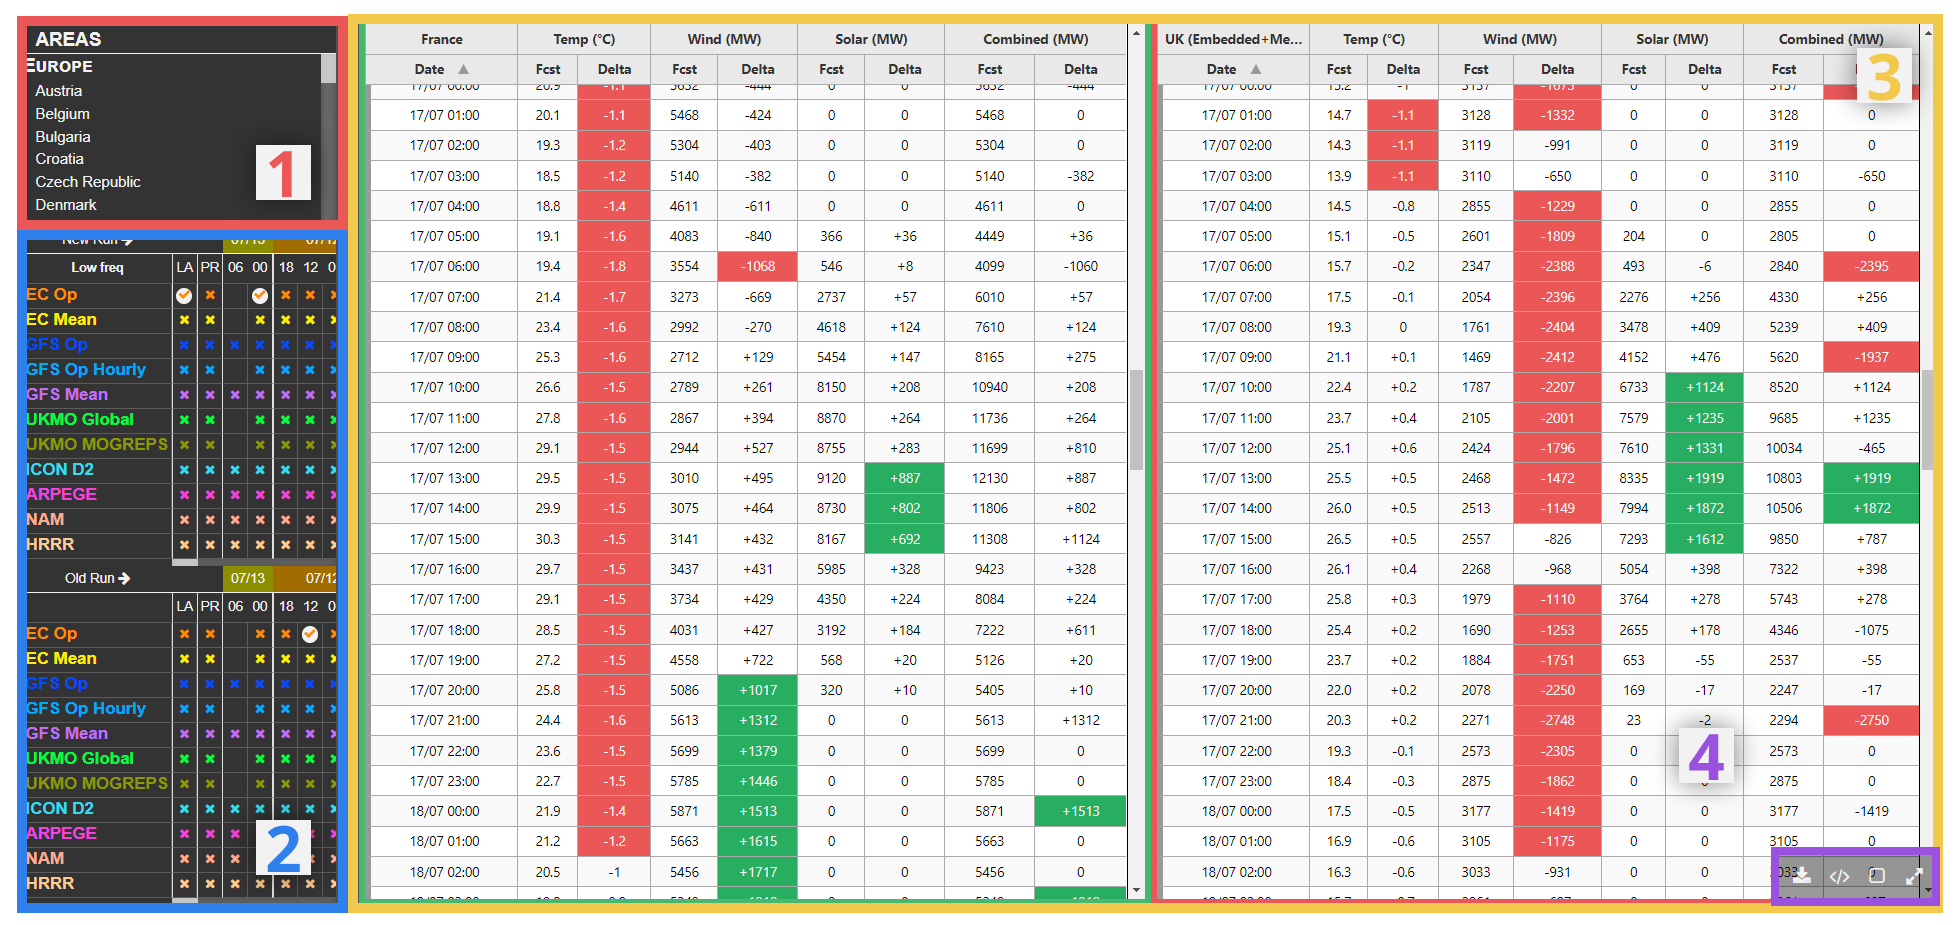
¶ 1) Area Select Panel
Within the panel, the user can select the area/country to display in each of the two tables. First select a graph using the relevant button in the toolbar (see section 4), then select the required country.

A. Area selected for left table (highlighted green)
B. Area selected for right table (highlighted red)
C. Area unselected
¶ 2) Model Matrix
The matrix system is how users select the source of data for each of the tables. There are two matrices so that a comparison between two models or model runs can be made. The delta is calculated as the Matrix i Selection minus the Matrix ii Selection. If the matrices have the same selection, the delta will be shown as zero for all data values.
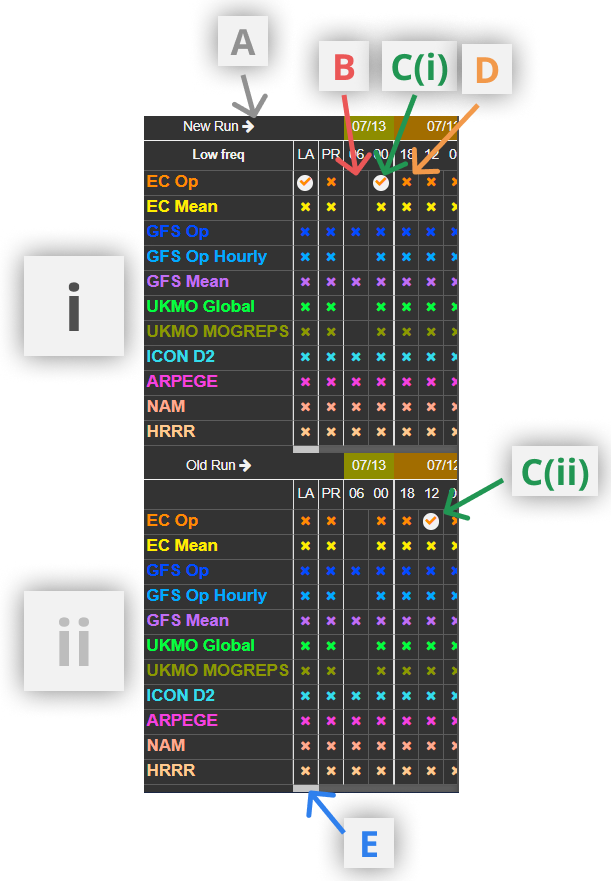
A. Expand matrix to include model runs back to 10 days
B. Unavailable model run
Some models are not available at each time given.
C. Selected model run
Those model runs available and unselected are marked with a cross
F. Available model run
An example of a model run that is available but not selected.
"LA" selects the latest available run for a given model.
"PR" selects the model run before the latest available for a given model
F. Scroll to view older model runs
¶ 3) Tables
The tables can be scrolled through using the scroll bar to the right or using a mouse wheel.
¶ 4) Toolbar
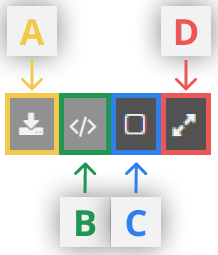
A. Download Data (csv)
Download the raw data from the tables in csv format
B. Download Data (xml)
Unlike option A, this format is more easily viewed with styling in spreadsheets
C. Select table
For use when selecting the area for each table
D. Full Screen
View one table in full screen. To return to the original view, select the same button on the right of the toolbar again.