The Zonal Wind tool provides a comprehensive graphical interface for monitoring wind and temperature forecasts in the stratosphere. The product, focusing on mid-high latitudes in the northern hemisphere, shows ECMWF and GFS forecasts and observations which can be compared to climatologies and an archive of historical data.
.png)
¶ 1. Main chart area
Graphically view and interact with the data selected in the panels below. Adjust the data displayed using the panels to the left of the chart area. Here, the user can also zoom in to certain time periods and hover over the graphs to view the tooltips showing numerical data.

A - Click and drag towards the right to select area to zoom in (x axis). After zooming in, the option to reset to the zoom to the default view appears in the top-right of the panel.
B - Climatology lines, with data back to 1980. Mean, 95% percentiles and max/min values plotted. Toggle on/off in the options panel
C - Observations. These use model initialisation points, given the lack of true observations. Daily resolution.
D - Tooltips. Hover over the graph to show data values for each of the plotted lines.
¶ 2. Options Panel
In this panel, extensive options for customisation of the graph area are housed, except the options for selecting model data (see Model Matrix) and the the data options in the toolbar.
For example:
- Switch between displaying data in speed or temperature
- Change the atmospheric pressure level for the daata
- Add or remove climate values and observations
- Change the Latitude and Longitudes used in the calculate the data
Under the 'Obs' heading, the user can also add or remove data from previous years (back to the 1979/80 season).
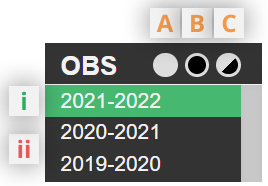
Toggle each year on/off (running June to June) but clicking on it. Those highlighted in green (i) will be shown on the chart, while those not highlighted (ii) will not be displayed.
There are also the following options:
A - Select all years
B - Unselect all years
C - Invert the current selection i.e. show all years currently unselected and vice versa
¶ 3. Model Matrix
In the Model Matrix the user has the option to choose the model data (forecasts) displayed in the main graph area. The operation runs and ensembles (mean and individual members) are available for both the ECMWF and GFS models, as well as the longer range EC46 and CFS ensembles. With the model matrix, data is available for the current day's forecast and the previous 7 days.
.png)
A. Expand matrix to include model runs back to 7 days
B. List of available model runs
Some models are not available at each time given. "LA" selects the latest available run for a given model. "PR" selects the model run before the latest available for a given model. Selecting "LA", "PR", or any of the available model run times will display all available data for that time.
C. List of available models
Selecting a model here will display the most recent two model runs
D. Scroll back to older model runs
E. Example of model run unavailable
F. Example of unselelected but available model run
G. Example of selected model run
¶ 4. Toolbar
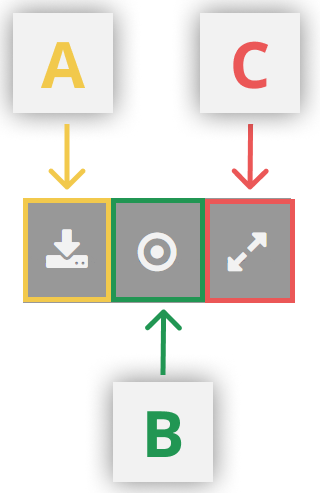
A. Download Data
Download the raw data from the graph in csv format
B. Toggle tooltips on/off
C. Full screen