A dashboard is a fully customisable page which allows the user to add their own combination of products in panels on the screen.
¶ Who can create a dashboard?
Dashboards can be created by those with the following section in their menu bar:

Please contact your account manager for further information if this option is not available.
¶ What makes up a dashboard?

- Time bar
Used to control the time steps of panels which contain maps.
The time bar only appears when map panels have been created.
See info in the maps / satellite product documentation. - Controller
Change the content and view of the panels.
The format of the controller changes depending on which panel is selected. - Display
Usually made up of multiple panels (four, labelled 3a-3d in this example), all of which are fully customisable using the controller.
Each panel is bordered by a certain colour which distinguishes it from the others and relates to the colours within the controller.
While dashboards are primarily designed to contain multiple panels, they can also be used to create editable versions of products (such as maps or power charts) which may contain just one panel.
¶ Creating a dashboard
To create a new dashboard, select the "+" button towards the right hand side of the menu bar:

You will then be prompted to give the new dashboard a name; click in the box and type in a name.

Once finished, select "next".
The next stage in the dashboard process is to select the product type for the first panel. The choices are as follows:
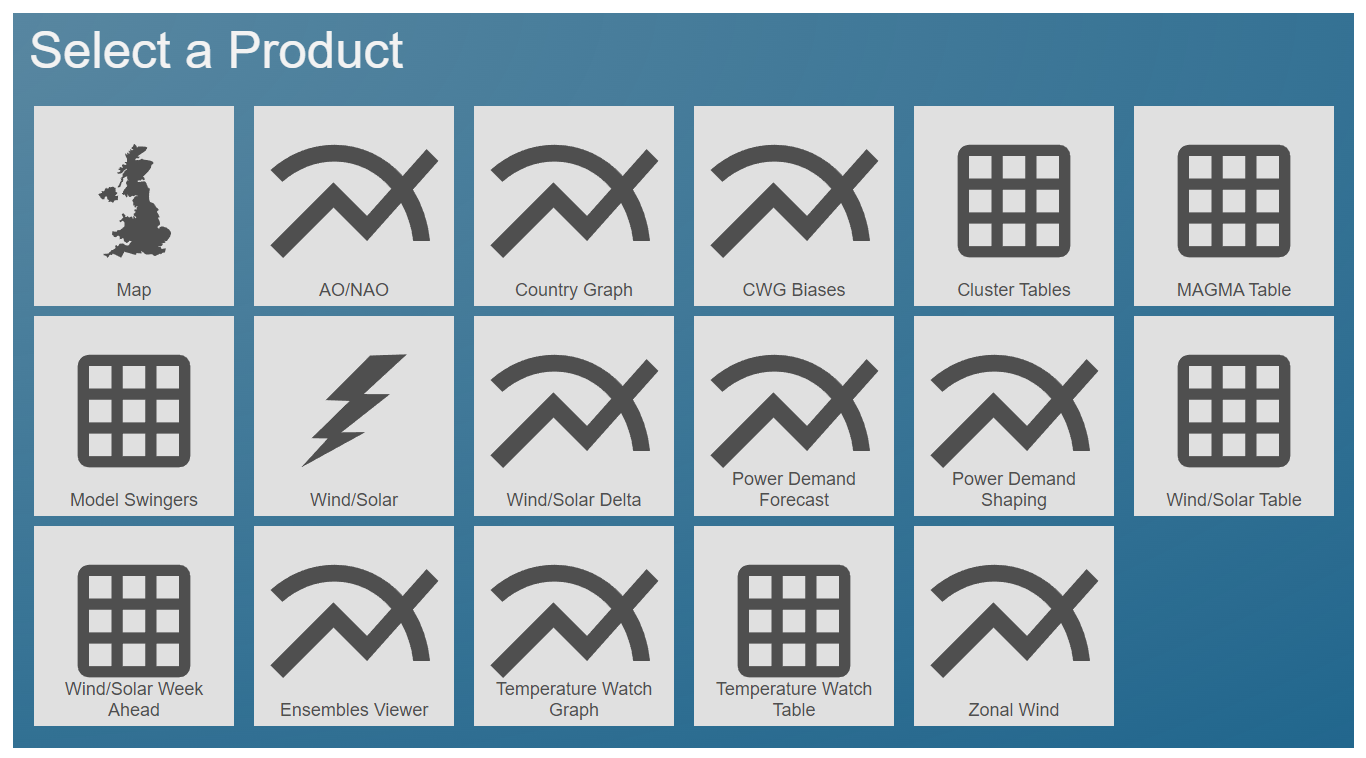
This will form the start of the dashboard and will initially cover all the panel area until further panels are added...
¶ Adding and deleting a panel
After the intial product type is select, one panel is shown as below (power product in this example).

Adjustments can be made to the view/content of the panel using the menu on the left hand side of the screen, just as within the equivalent individual products on Trading Weather. These changes can be made straight away or at a later stage after further panels have been added.
- Add panels
A panel can be added above/below or to the left/right of the current panel. There are buttons to carry out this process at the top/bottom/right/left of the current panel.
There are two options when adding a section in a particular direction:

A - Add panel near
B - Add panel far
After selecting one of these options, the user is then prompted to select the product type of the new panel, in the same way as the first.
- Delete panel
This option deletes the relevant panel from the dashboard. Any others remain unchanged, except for the fact that they may adjust to size to fit the screen once more.
If this option is selected when there is only one panel in a dashboard, the user will be returned to the naming section of the process. To completely delete the dashboard, select the relevant option in the menu bar (see editing mode help section)
¶ Using a dashboard
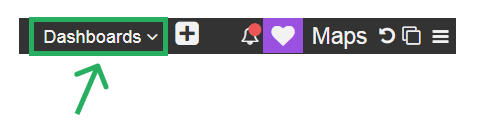
To open a previously created dashboard, hover over the dashboards list on the menu bar and select from the dropdown menu.
¶ Menu bar dashboard specifics
While the menu bar is present at all times when using Trading Weather, it has some differing characteristics and options when a dashboard is selected.

- Rename
Available when in 'edit mode' which is toggled on/off using button 7 (see below).
When not in edit mode, this part of the menu bar just displays the name of the dashboard. - Lock
Lock or unlock the dashboard.
When unlocked the dashboard can be full edited, including adding/deleting panels and changing the default content within them.
When locked, options 1, 4-5 and 7 not available in the menu bar, so the dashboard cannot be edited. While changes to the content can be made, these will return to default settings in the next user session or after a page refresh. - Duplicate
This option will create an exact copy of the current dashboard and take you directly to this copy.
This option can also be used when viewing a default product on Trading Weather in order to create a editable version of a product, thus turning it into a dashboard.
- Delete
Delete the current dashboard. A deleted dashboard cannot be retrieved. - Save
Save changes to a dashboard.
This option saves changes done outside of editing mode (e.g. changes to content in the panels) as well as changes within editing mode (any changes, including adding/deleting panels). - Share
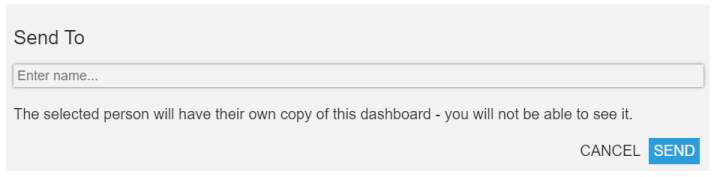
Share dashboard with another another user. Search for then select the name of the user you wish to send the dashbaord too.
- Editing Mode
Enter or leave editing mode.
When in editing mode, "Editing" is highlighted in purple and any change can be made to the dashboards, both construction or content.
Out of editing mode, this button is shown as "Edit", and name and panel structure changes are locked.
¶ Controller specifics
The content within each of the panels is changed using the controller. The controller automatically changes format depending on the product type of the panel selected for editing.
A panel can be selected in two ways: firstly by clicking anywhere on the panel and secondly by clicking on the 'select' button in the toolbar of the panel.

A. Selected panel
Notice the thicker coloured border to the selected panel.
B. Unselected panel
Multiple panels can be selected at one time, but note that if these include more than one type of product, only one controller type will be shown, so any changes made will only affect one type of panel.
For example, for a given dashboard with four panels (2 map, 1 power, 1 CWG):

- Controller format with one of the map panels selected (orange border). Changes in the controller will affect just the orange bordered map panel.
- Controller format with both map panels selected (green and orange borders). Changes made in the controller will affect both map panels.
- To change the controller type/format without selecting/unselecting panels, use the drop-down menu at the top of the controller.
- Selecting 'Power' for example from the dropdown menu will bring up the Power controller format.
For more information on how to use the controllers for each of the product types, see the documentation for each product.
¶ Timebar specifics
When saving a dashboard with a timebar, the current time step will also be saved as the default on opening.
In dashboards which contain both satellite and model maps, the time frames are changed to include the date and time as below:

¶ Map Model Run Comparison
One use of the dashboard system is to create multiple map panels to compare different model runs. This involves needing to select two or more model runs in the time bar.

- Run time of green map panel
- Run time of red map panel
Despite the different model run timings, the absolute times are synced between the maps. - Latest data
With this option selected, the data in the panels will change as new model runs arrive, but their relative positions remain the same e.g. in the figure above, the red map panel will always show one model run older than the green map panel. - Time steps only from the older model run.
To remove this option and to only show time frames common to both model runs, unselect the "all" buttom in the timebar.
¶ Map Model Comparison
When there are multiple map panels within a dashboard and these display different run times or run lengths, then there will be timesteps when maps only exist for some of the panels.
To view only the timesteps where maps exist for all panels, leave the "all" box unticked, as below (1).

The number of frames not shown are also shown (2).
When the "all" option is selected, all timesteps are shown, whether there are maps available for all panels or not. In the case where one or more of the panels do not have a certain timestep or run available, the closest available is shown and a label is displayed in the bottom-left of each panel.

- Showing closest time step, but model run is in line with other panels
- Showing closest model run (run time displayed), but the current time step is in line with other panels
- Showing closest model run and step