¶ Satellite Content
On our Trading Weather suite we offer a selection of satellite imagery based on data from EUMETSAT’s MSG satellites and their SEVIRI instrument in 5 and 15minute intervals.
¶ A) High Res Visible
A high resolution image showing the visible light spectrum with a spatial resolution of 1km in sub-satellite point (appx 2km for UK). Available only during daylight hours, this imagery is useful for observing cloud changes with a higher detail.
¶ B) Infrared
The infrared channel detects cloud-top temperatures, indirectly giving the heights of the highest clouds in a particular region. Brighter colours show colder cloud-tops and as a result higher clouds. The presence of lower cloud is often masked by higher clouds. Severe thunderstorms with an overshooting top are usually the coldest clouds to observe using this channel.
¶ C) Enhanced Infrared
As infrared channel above but with the coldest cloud top temperatures highlighted in a colour spectrum, making it easier to pick out the highest clouds. In some situations this can be used to estimate the location of rain. Severe thunderstorms with an overshooting top are usually the coldest clouds to observe using this channel.
¶ D) Water Vapour
These channels detect water vapour concentrations in the atmosphere. It is best used to infer vertical motions within the atmosphere, particularly when it comes to the intensification of cyclones, and to see areas of high moisture content.

¶ RGB Products
RGB composite images (Red, Green, Blue) are based on simultaneously combining the information obtained from multiple individual channels during a particular timestep to create a colorful image which helps to distinguish particular parameters by assigning them individual colours. A similar approach has been applied to generate the other RGB products on our trading website, often tailored to highlight features of higher importance for the traders.

E) Day Microphysics
This product shows similar output to the “Natural Colours RGB, but modified to highlight high cloud from low cloud and snow covered areas from bare land in a blue colour. The land in this instance appears red/brownish.

F) Night Microphysics
This product uses a range of satellite channels to diagnose cloud heights during the night-time period. The image can distinguish between high, medium and low levels clouds, as well as areas of land or sea. This image is particularly good at highlighting areas of low cloud or fog during the night-time hours.

G) Dust RBG
This RGB product allows the user to track the movement of areas of high dust concentrations in the atmosphere. Dust will usually move northwards out of the Sahara towards mainland Europe. While a fairly uncommon phenomena, dust reaching up into Europe can end up falling on solar panels, reducing the potential output until they are either washed or cleared. Dust particles will also have an impact on solar generation when the sun is on a lower angle, resulting in a greater reflection of the incoming radiation and therefore lower solar generation.

H) 24 Hour Microphysics
I) Airmass
J) Natural Colours
“Natural Colours RGB” are images of reflectance from three solar channels, VIS0.6, VIS0.8 and NIR1.6. This particular color scheme highlights vegetation with green color because of its large reflectance in the VIS0.8 channel (the green beam) compared to the NIR1.6 (red beam) and VIS0.6 (blue beam) channels, water clouds with small droplets in white because of its large reflectance in all three channels, snow and ice clouds in cyan because ice particles strongly absorb in NIR1.6 (no red), bare ground in brown because of the larger reflectance in the NIR1.6 than at VIS0.6, and the ocean in black because of the low reflectance in all three channels.
¶ Solar Radiation
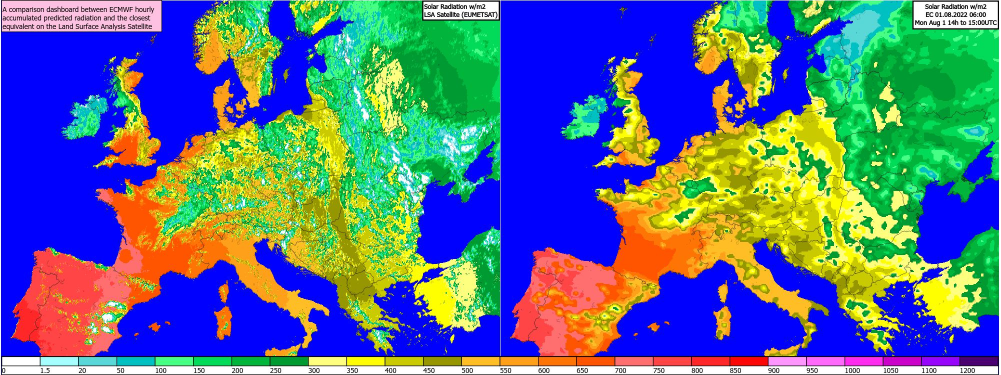
A satellite-based estimation of solar radiation reaching the surface (direct and diffuse) in W/m2.
There is also a product which compared data from this satellite image with the ECMWF operational run solar radiation parameter for that time frame. This allows the user to see how well the EC Op is performing versus actual conditions.
Forecast Solar v Land Surface Analysis Satellite
¶ Forecast Cloud v High Res Visible
This product displays the visible satellite imaginery, overlaid by cloud amounts from the ECMWF operational run, interpolated to match the higher frequency updates from satellite images compared to model output. This provides a view of where the EC Op is performing well or poorly at capturing the current cloud cover.
_1.png)