The Maps product of Trading Weather is a vast section of range of forecast model output with hundreds of parameters and regions across the globe. There is also a selection of observation data and some more graphical sections.
This page describes how to navigate the Maps product.
You can find more information on the various models displayed on Trading Weather here
You can find more information on the different ways in which the model data is used in maps and charts (e.g. clusters, archive forecasts, model compare) within the Maps product here
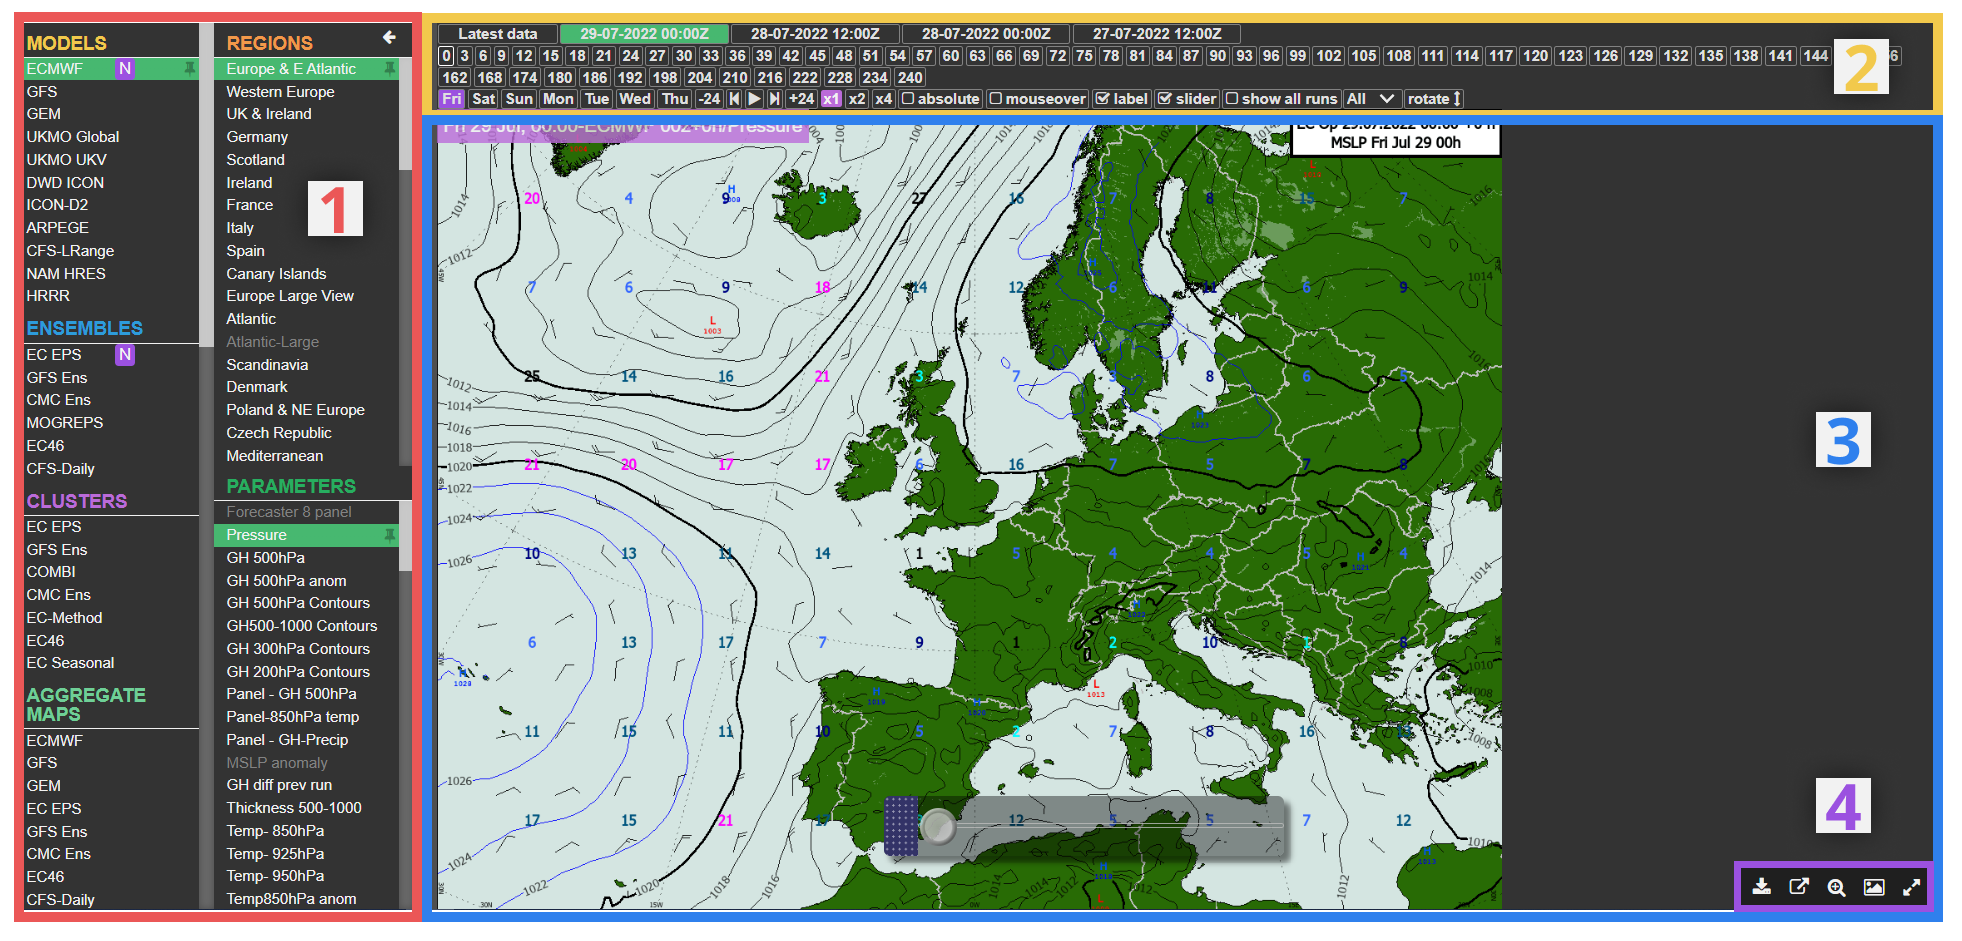
¶ 1) Panel (Content, Parameter, Region Selector)
The panel to the left of the screen is the main way to determine the content of the map in section 3 of the screen. The panel is divded into two columns: the first relating to the model or type of map, while the second refers to the region the map covers and the parameters on the map.
¶ Column 1: Content
The following content is available* within the Maps section:
- Models - Including from GFS, ECMWF, UKMO, GEM, ICON, ARPEGE and CFS Long Range.
- Ensembles - Including from GFS, ECMWF, UKMO, CMC.
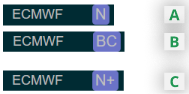
For ECMWF operational and ensemble models, there is an additional option to select, to toggle between using the boundary condition (BC) runs or not.
A. View timesteps for Main (00z and 12z) runs only
B. View timesteps for ALL ECMWF runs, including the BC (06z and 18z) runs
C. View hourly resolution of the Main (00z and 12z) runs. (ECMWF Operational ONLY).
- Clusters - Intelligently grouped ensemble members showing similar forecast scenarios.
- Aggregate Cluster - Grouped clusters for week-long periods (7 days) based on ensemble data within the run.
- Model Compare - Multi-paneled maps (users can create their own panels during the dashboard feature) and delta maps.
- Extreme Forecast Index
- Seasonal Models - A full suite of longer range models with a forecast horizon extending over several months.
- Aggregate Maps - Maps with parameters averaged over a 5 day period.
- Teleconnections - Including visualised MJO activity and snow cover.
- Market Mover - MetDesk’s forecast of the forecast product for EC and GFS Op runs, including verification.
- Observations - Observations for the UK and Europe are available from all SYNOPs and METARs.
- Satellite Live - Data from various satellite channels are available in this section or from within the separate satellite product.
- Archive Forecasts - Selected parameters are available to view here for model runs dating back further than the standard five used elsewhere in the maps section.
*Please speak to your account manager for information on which maps are available to you.
When a model is selected, a corresponding region and parameter combination will be selected - this allows for seamless switching between maps from different sources and in different parameters.
¶ Column 2: Region + Parameter Selection
Once the content (column 1 above) is selected, the range of regions and parameters available will be shown in their relevant parts of column 2.
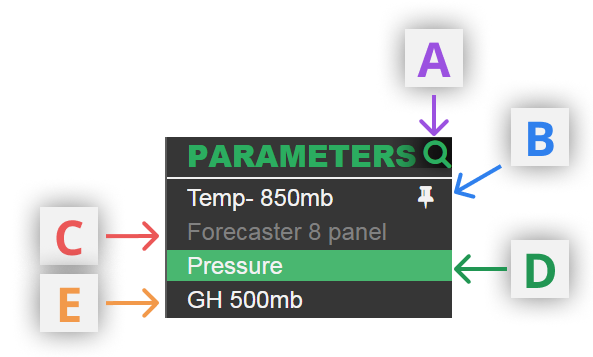
A. Search
Click the icon to the right of the Model/Region/Parameter heading to search with text for specific models, regions or parameters. For example, typing "temp" into the parameters search bar will return all temperature related parameters (for a given selected mdoel) and hide all others. Remove the text from the box in order for all models/regions/parameters to be displayed once more.

B. Pinning
This allows the user to customise the order of their parameters/models/regions list. Simply hover over the name of any map, parameter or region and click the pin that appears. This will pin the map/region/parameter to the top of its relevant list and will remain there (saved to individual logins) unless the user clicks the pin once more, releasing the order back to default.

C. Disabled for selected "Model + Region" combination
When an item is darkened, selection will trigger a sibling property to change (Region in this case)
D. Selected
Shows that the item is currently active for the map panel
E. Deselected
The item is available for selection and will not change the Region
¶ 2) Timebar
¶ Runs and Steps
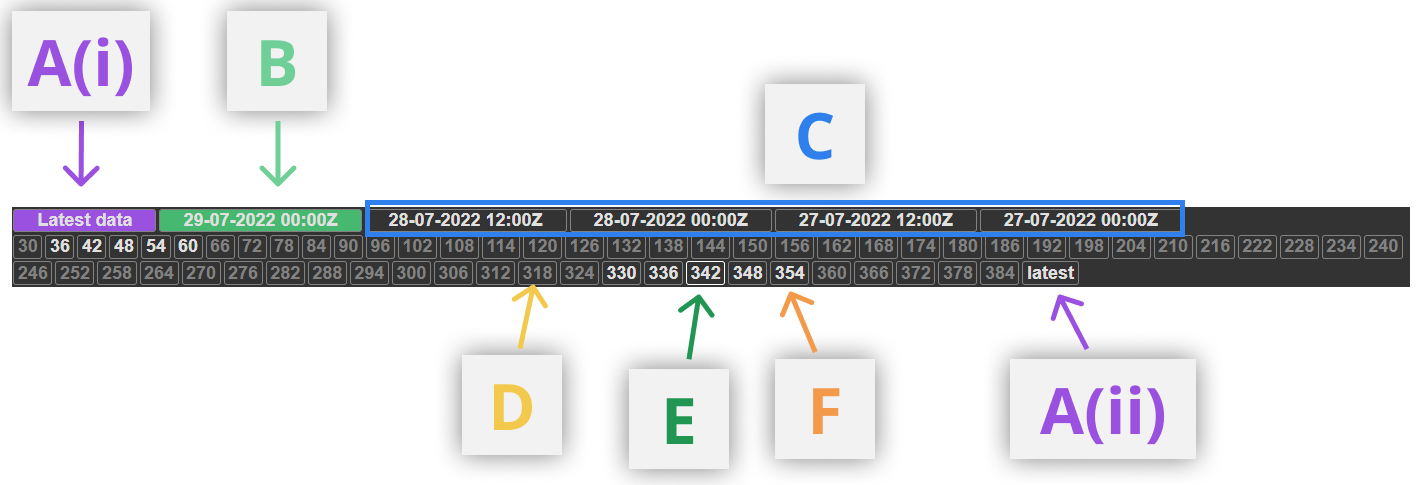
- Selected Step
The step has a white border, showing that the map will load this step - Loaded Step
Steps with solid white text are loaded and ready to display.
Depending on the map, either 1 or 8 steps will be loaded on either side of the current selection. When 'mouseover' mode is enabled, 8 steps will always be loaded - Available Step
Grey items show that the step is available, but not yet downloaded - Selected Run
Currently active run - steps are shown from only this run - Available Run
- Latest Mode
There are two 'latest' buttons, for runs and steps. As new steps/runs become available, they will be selected and displayed
¶ Extra Controls
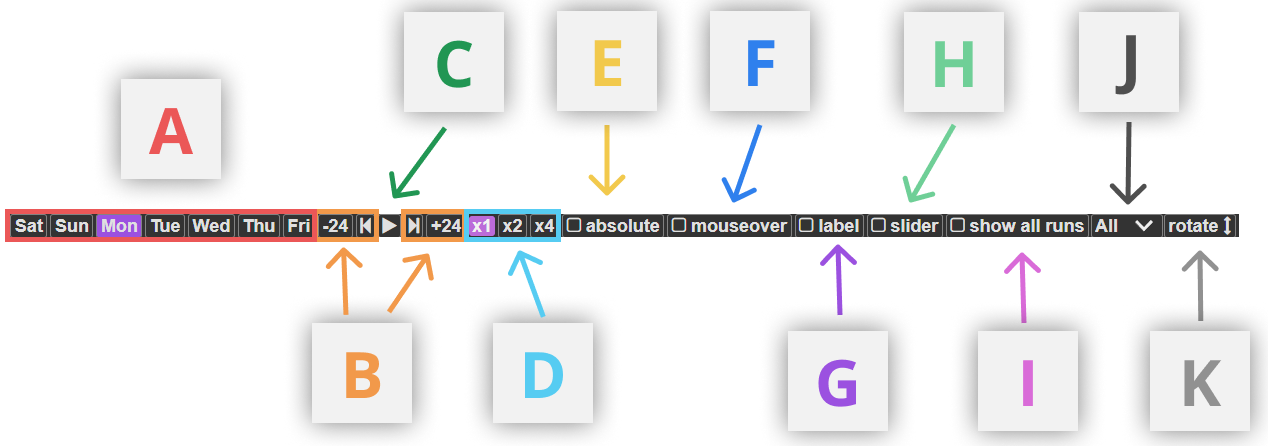
A. Day of Week
The days of the week covered in the selected model run are shown here. The day of the week of the currently selected time step will be highlighted in purple. Selecting a particular day of the week will jump the selected map towards the first available map on that day, usually the 00z time step on that day.
B. Step forward/back
Either 24hours or one time step.
C. Play / Pause
D. Animation Speed
Select from default, x2 and x4 animation speeds
E. Absolute
By default, time steps are labelled by the number of hours since model initialisation time. For example, if a model run is labelled as "12-07-2020 00:00z", the model output at "12-07-2020 15:00z" will show as default as "15" as that time is 15 hours after the model initialisation. When this absolute option is ticked, this default way of displaying time steps is changed so they are in the form "dd/hh".
F. Mouseover
Toggle on to change time frames by moving the mouse over the frames in the time bar
G. Label
Toggle on to show a label in the top-left of the map panel (3) displaying information on the current time step e.g. time, satellite image type
H. Slider
The slider allows the user to control scrolling through time frames using a sliding button. The location of the slider can be moved around the screen using (i), while the clicking and dragging button (ii) provides the main functionality of changing time frames.
.png)
I. Show All Runs
For content with very regular or numerous runs, or content for which the data is kept for a long period, by default, the majority of model run buttons are hidden under a dropdown menu labelled "More..." in order to conserve space in the Timebar.

To expand these model runs, select this option.
J. Frequency Change
This drop down menu allows the user to reduce the temporal frequency of time steps for satellite images. For example, instead of time steps for each satellite image being shown, often updated every 5 minutes, the frequency can be reduced down to 15 minutes, or several hours.
K. Rotate Timebar
Selecting this option will move the whole Timebar & Controls (2) to be displayed vertically to the right of the screen. This allows a greater vertical extent in displaying the satellite image itself.
¶ 3) Map
This area displays the chosen map. Right-clicking on the map reloads the image displayed there.
The purple label in the top-left of the image can be toggled on/off using option G from the option controls bar. The slider is toggled on/off using option H.
¶ 4) Toolbar
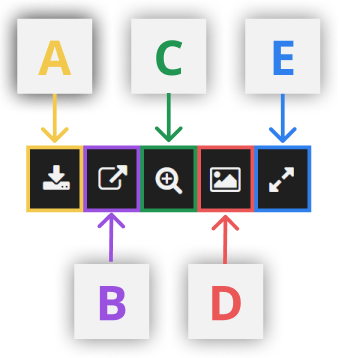
A. Download Image
Download current map to local machine
B. New Window
Open active map in a new browser window
C. Zoom In
Zoom in on the current map
D. Landscape Mode
View the current map in landscape format
E. Full Screen
View the current map in full screen.
Once selected, two further buttons appear in the toolbar allowing the user to step backward/forward through the time steps